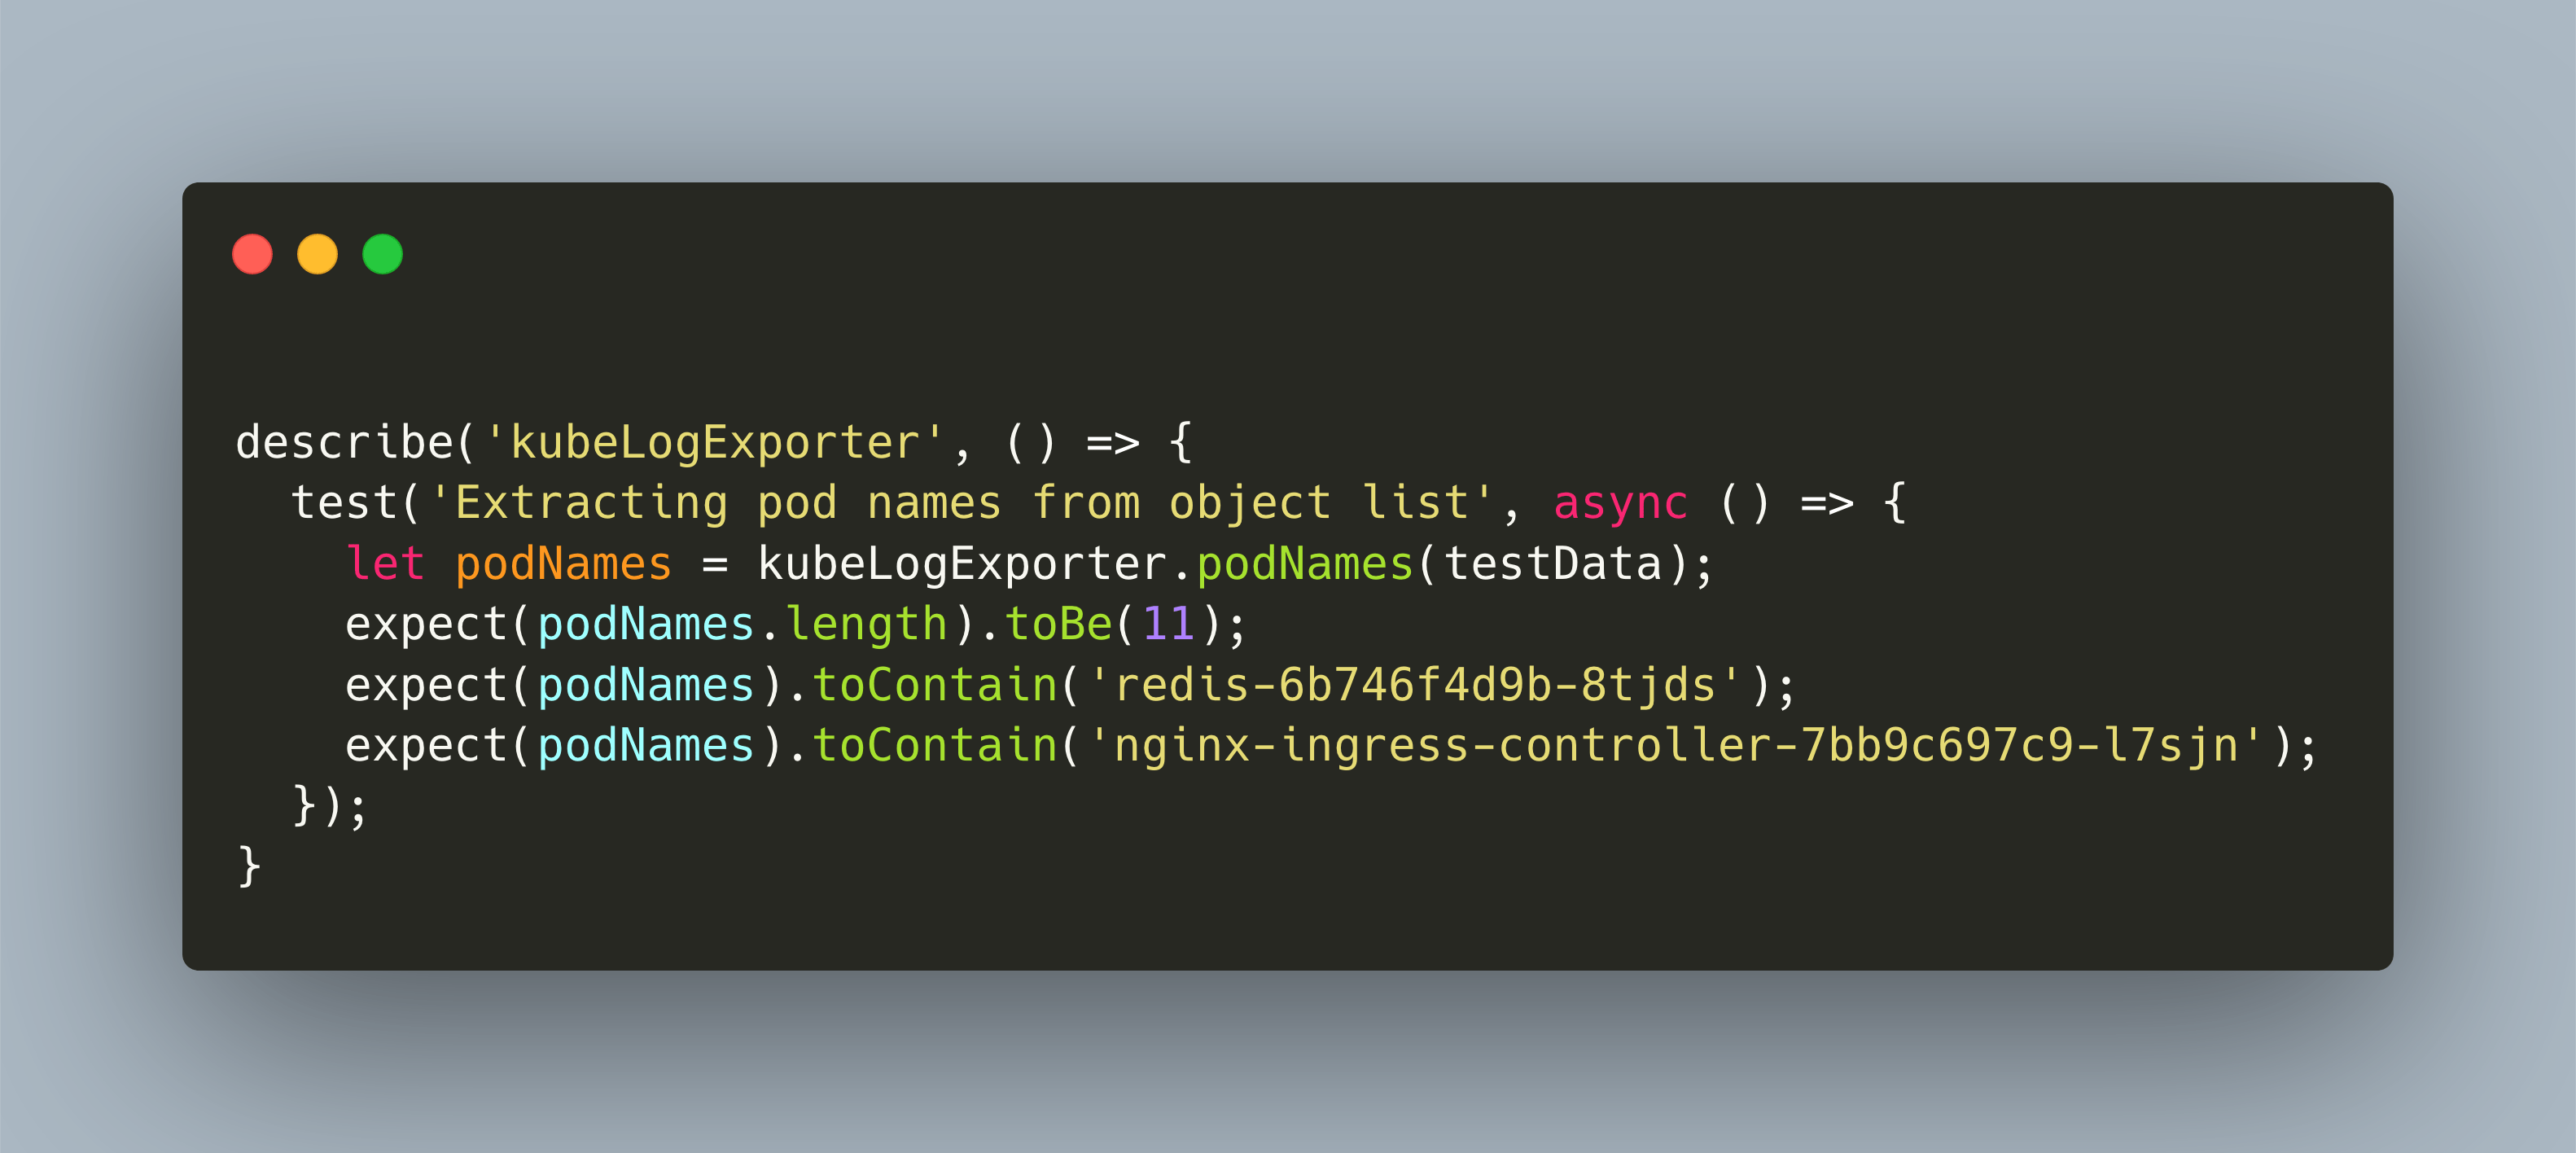
When you develop a prototype, functionality and features need to be delivered in time. You push feature after feature, relying mostly on manual tests and maybe, occasionally using automatic test as well. It’s not that you don’t want to test. Its more that time constraints make developing a stable code base and a stable test suite more tedious then beneficial. How to cope with this challenge?
With my Lighthouse-as-a-Service website scanner you can quickly check a webpage about its performance, SEO and best practices. Learn how I deployed the scanner with the lightweight Kubernetes distribution K3S
You have heard about #arduino, right? Small hardware boards on which you upload programs for a wide variety of functions. The NanoESP board is programmed with C++ and features wifi access. You can run a #webserver on it. Read about setup and first steps.
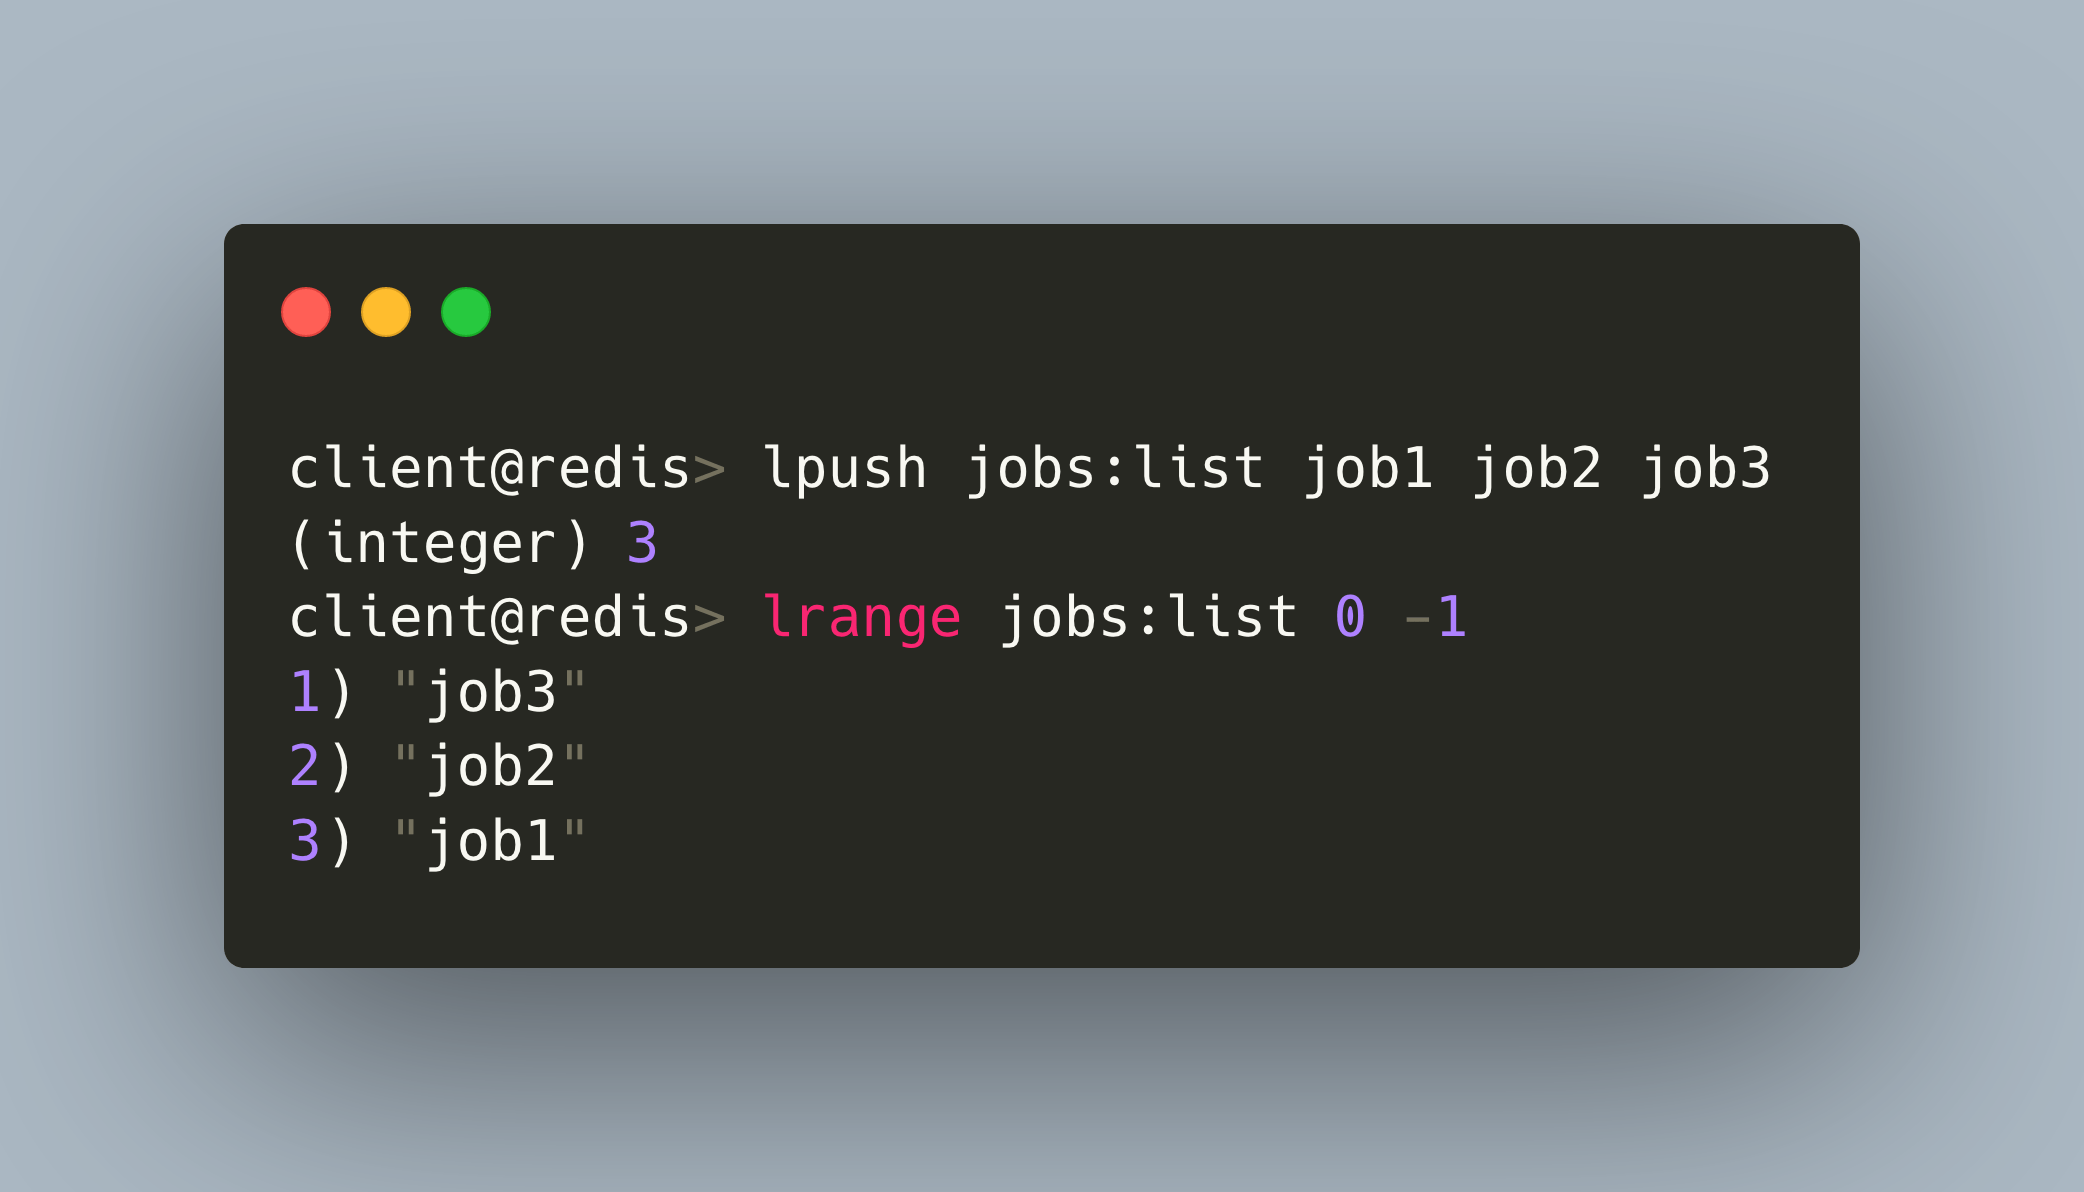
In a cloud environment, microservices need to be stateless so that containers can de scaled or restarted at any moment. What is a good solution? Read about how to build stateless microservices in NodeJS using the ultrafast #Redis in-memory database
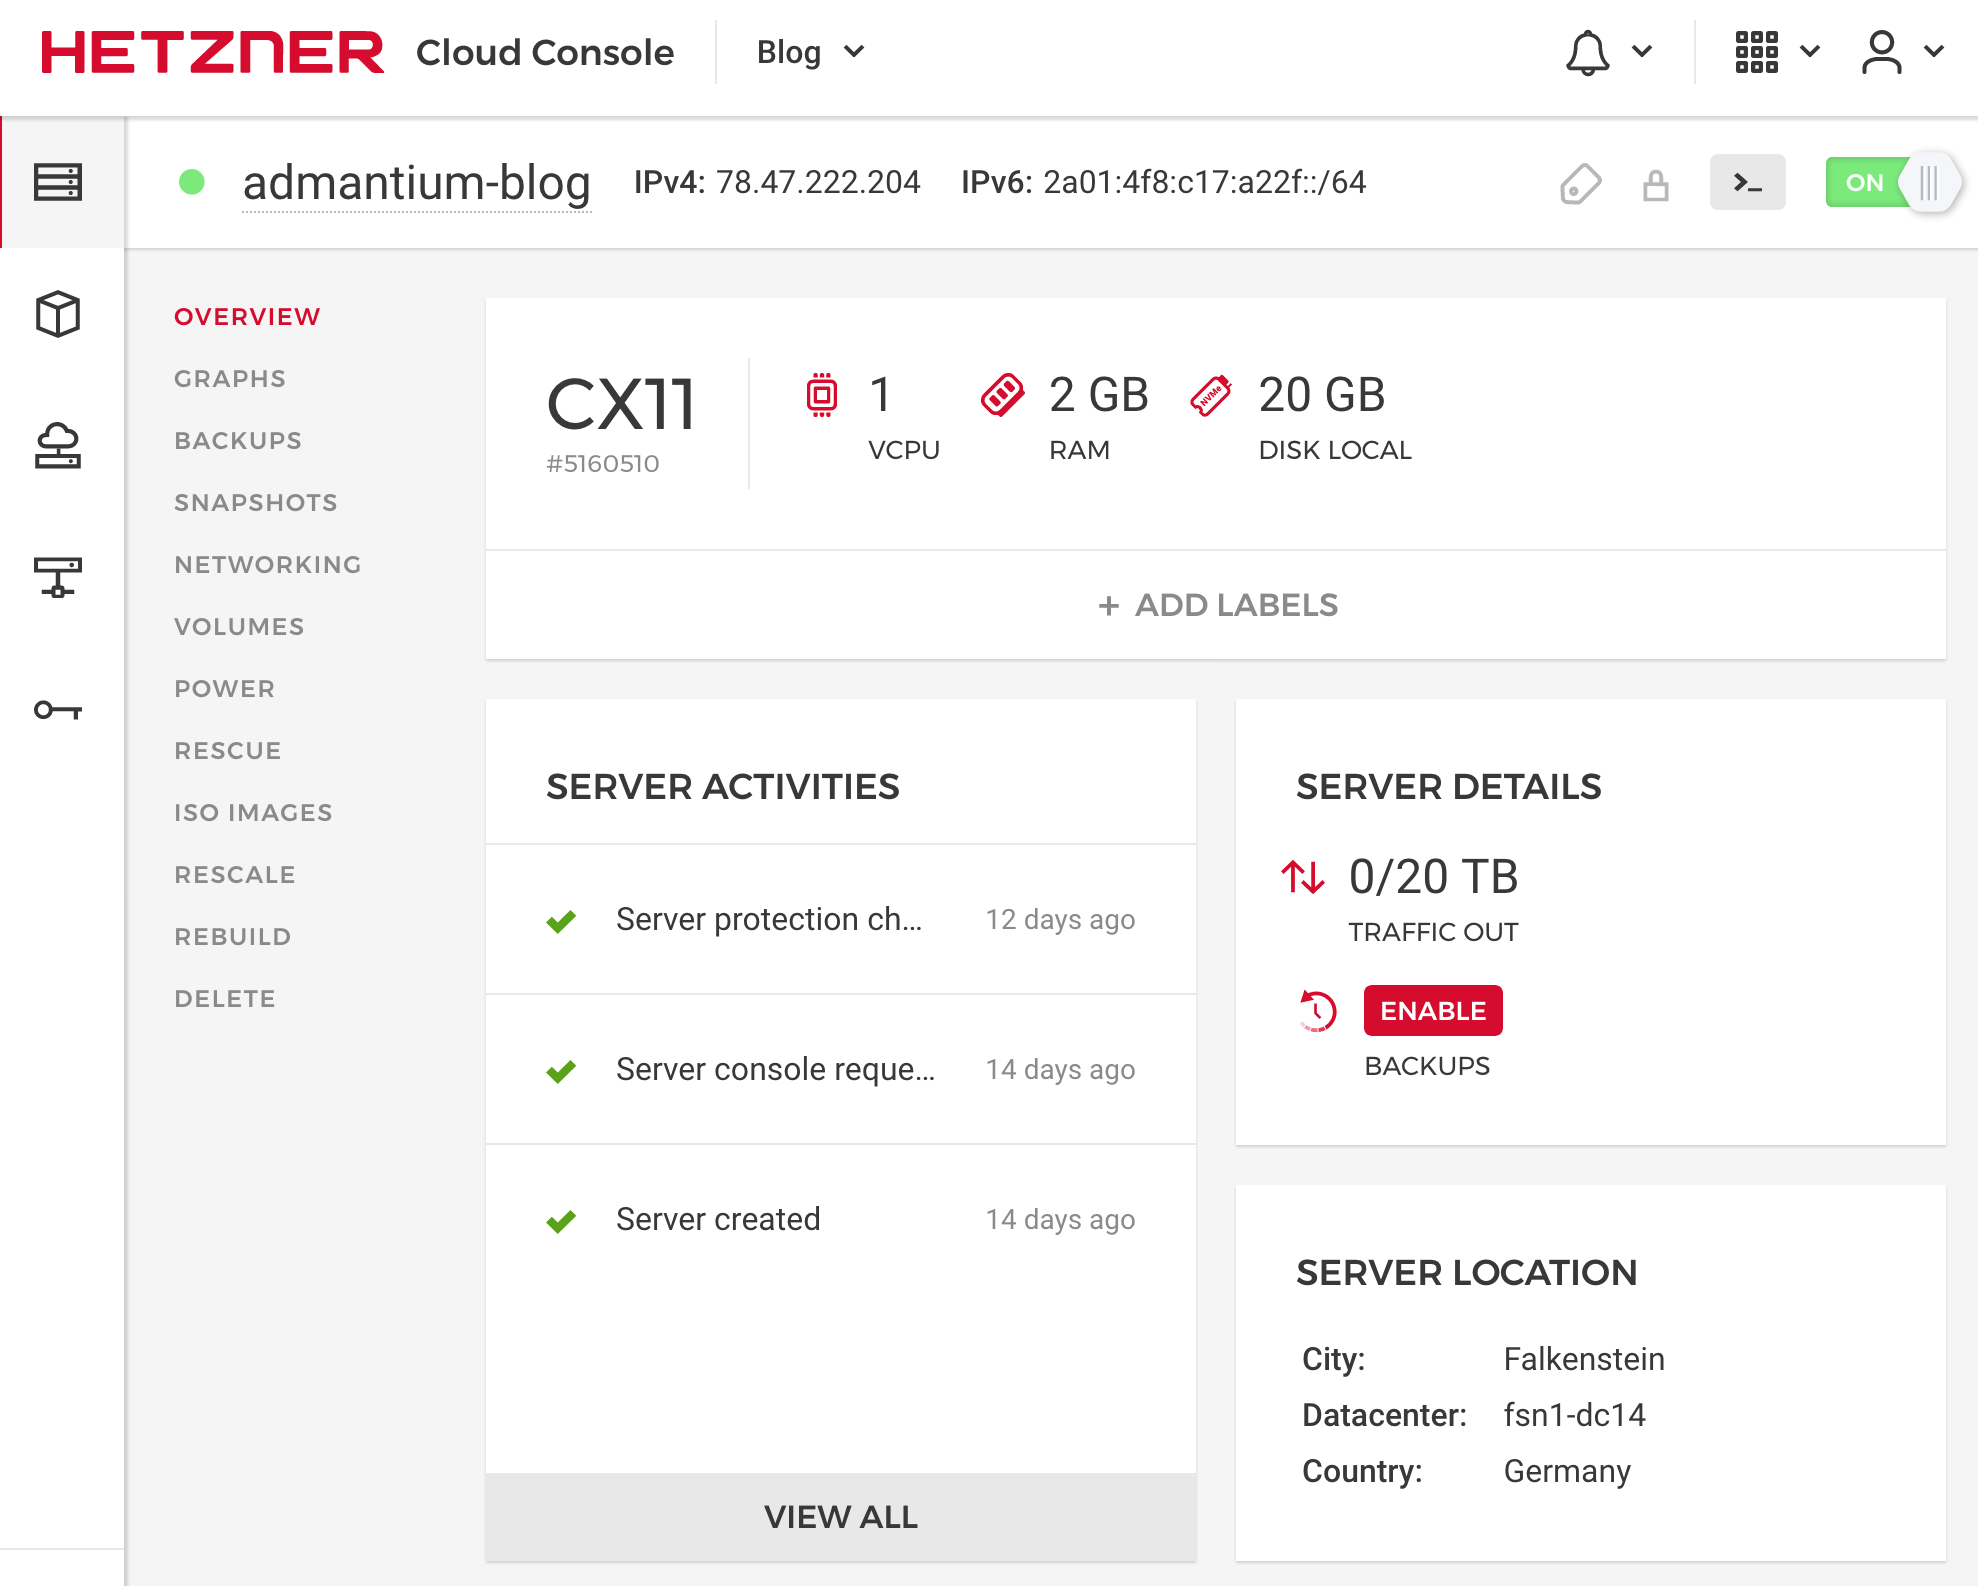
How do you run your blog? Managed Hosting? CMS System? Bare metal? My choice is a cloud server, provisioned by Ansible to setup and an Nginx web server with TLS. See how easy the setup and installation is in my new blog post.
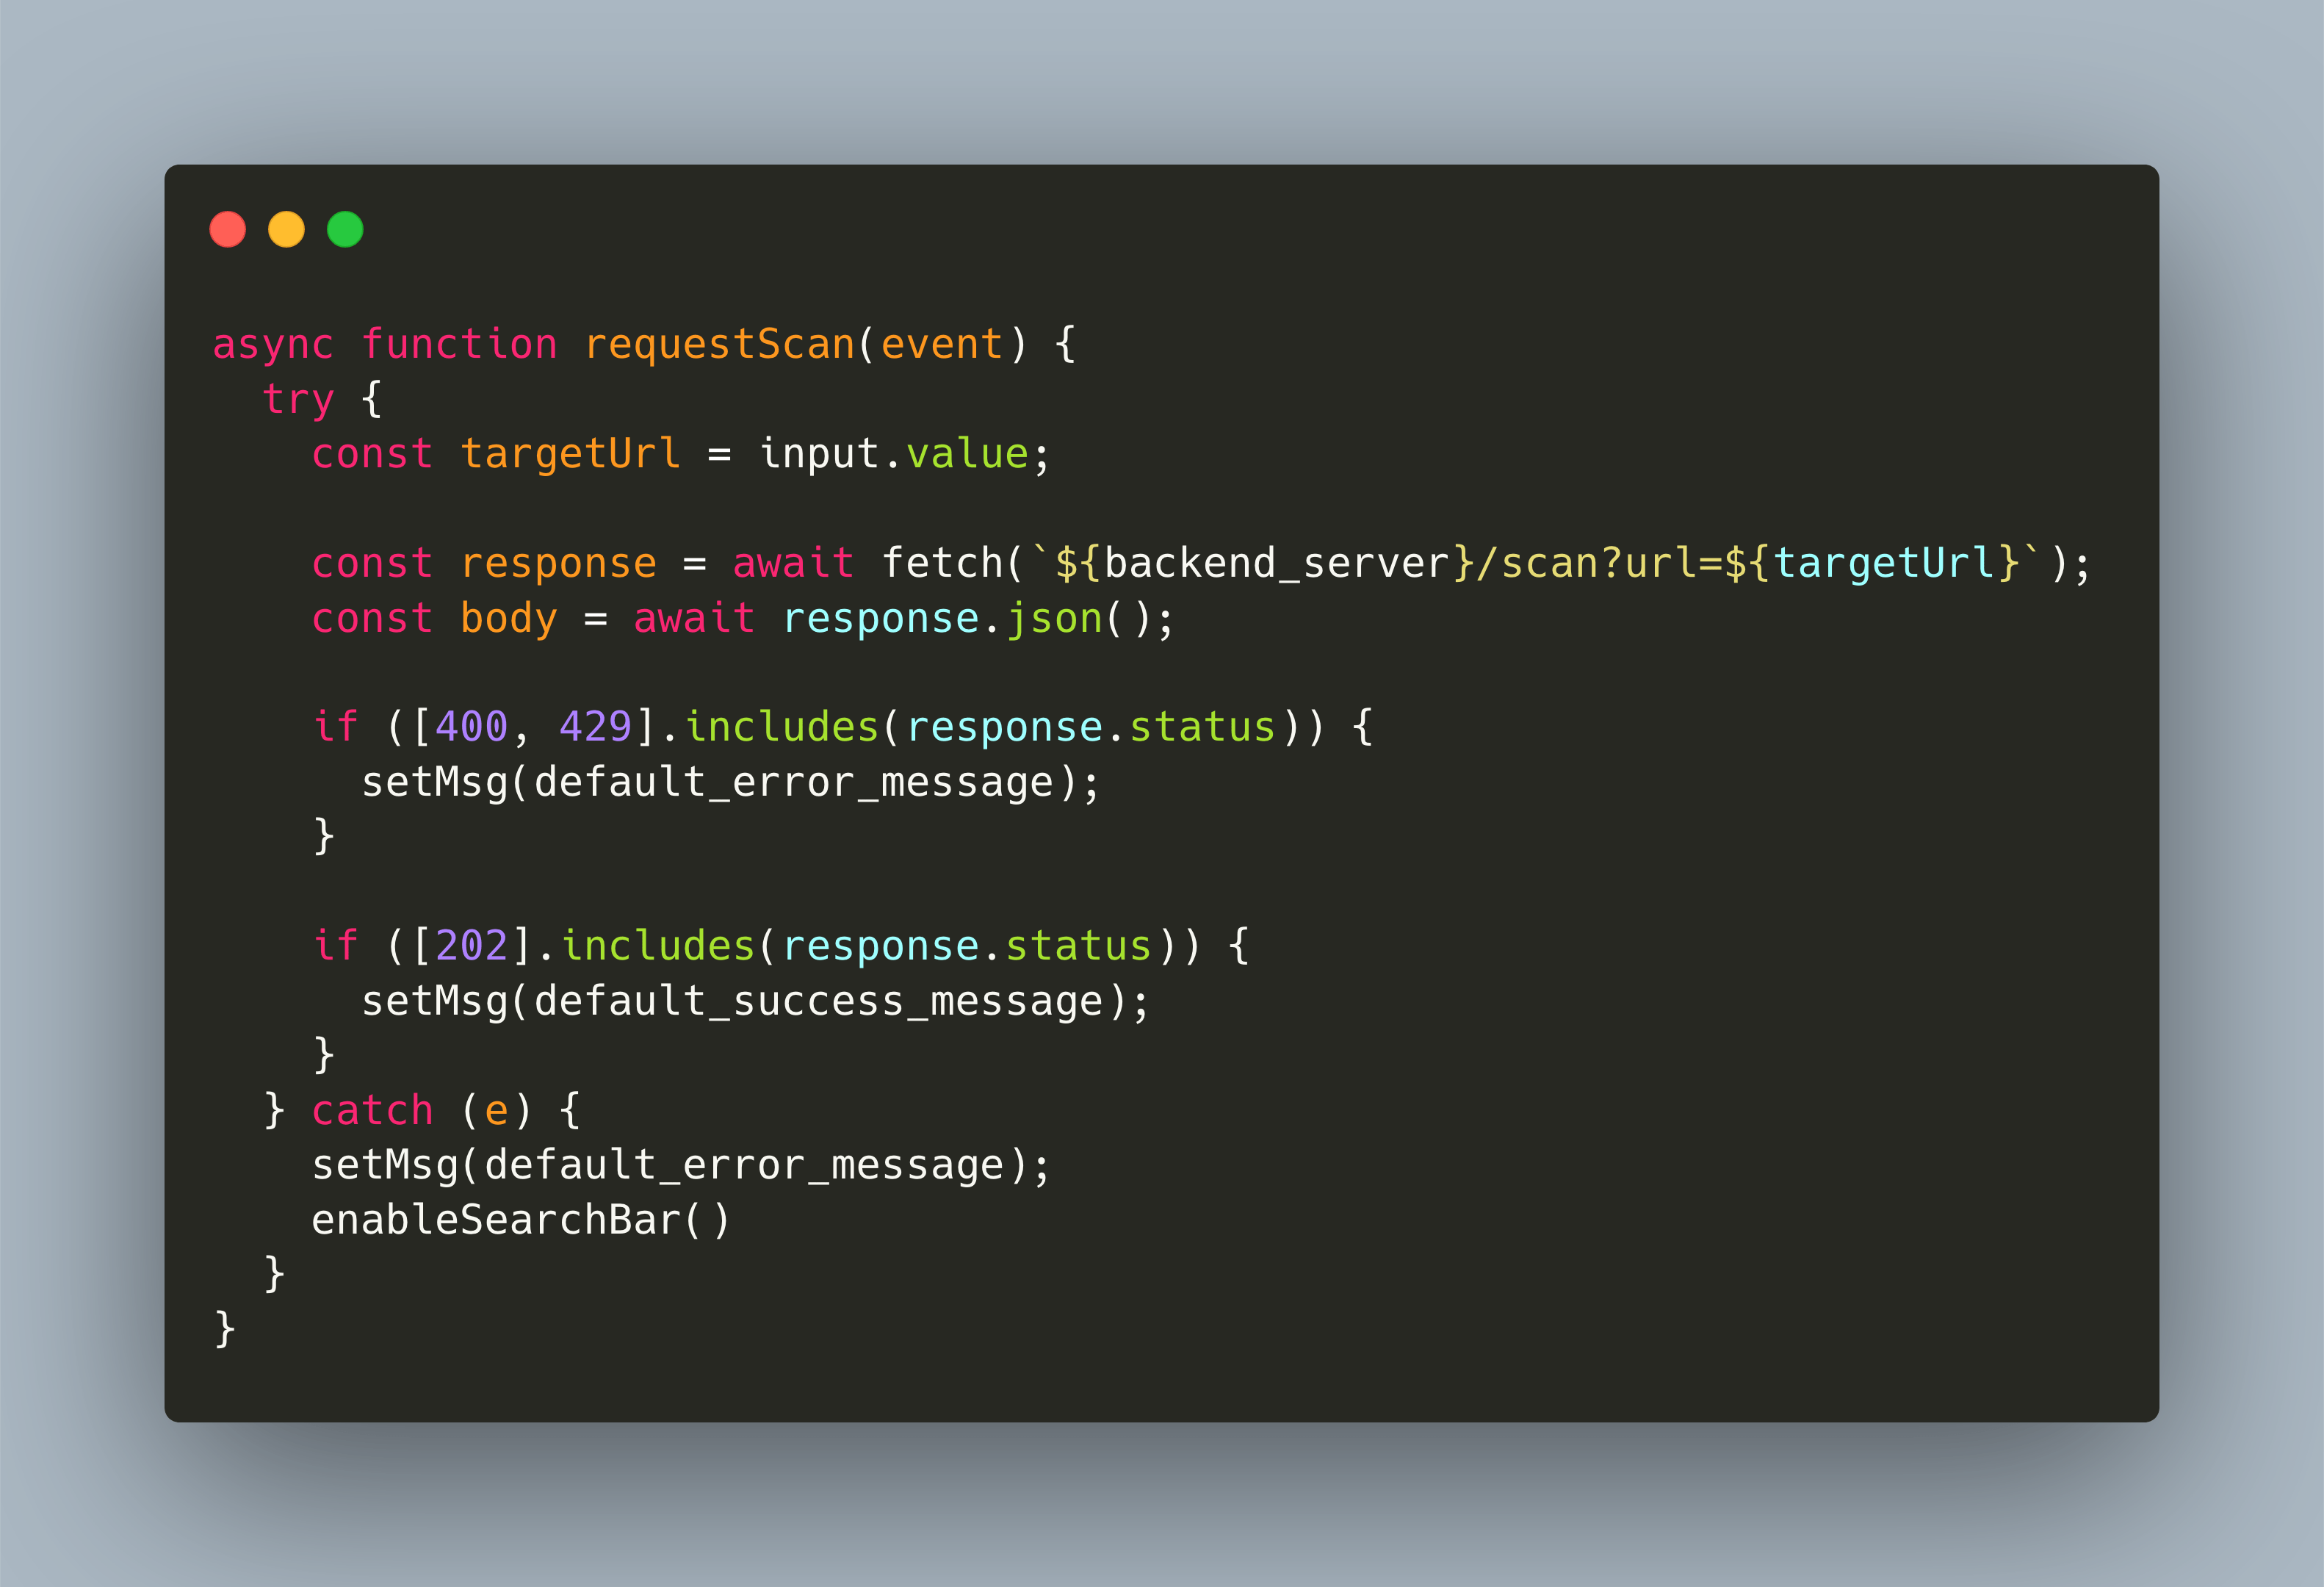
With my Lighthouse-as-a-Service website scanner you can quickly check a webpage about its performance, SEO and best practices. In my new article, I explain the frontend development of this service with delightful simple plain JS.
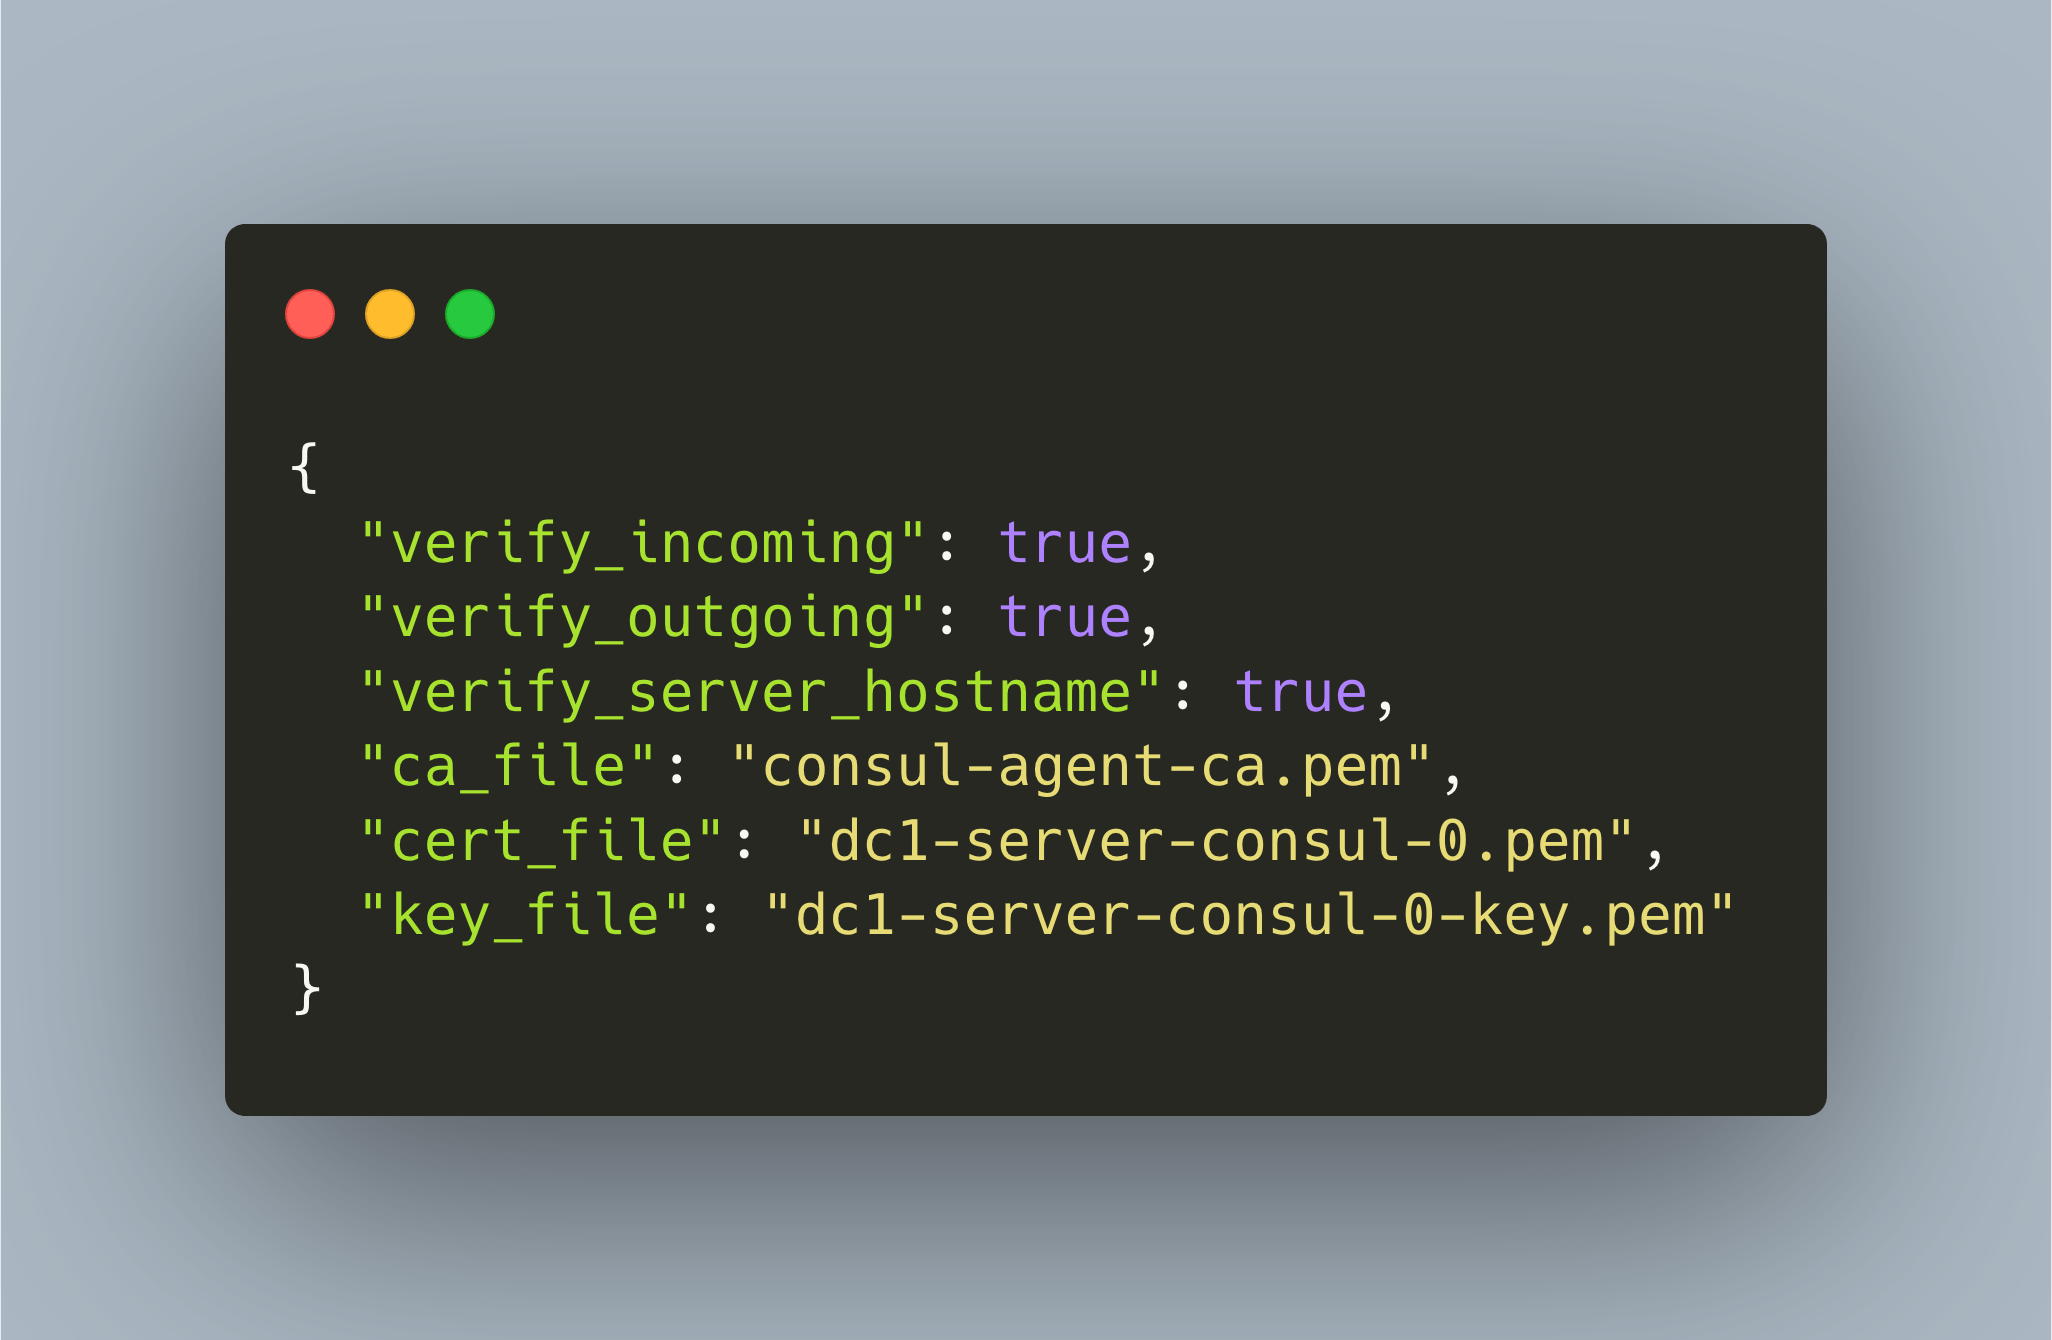
Plaintext messages are used for status synchronization in Nomad and Consul. Learn how to encrypt these messages with TLS in my new blog article...
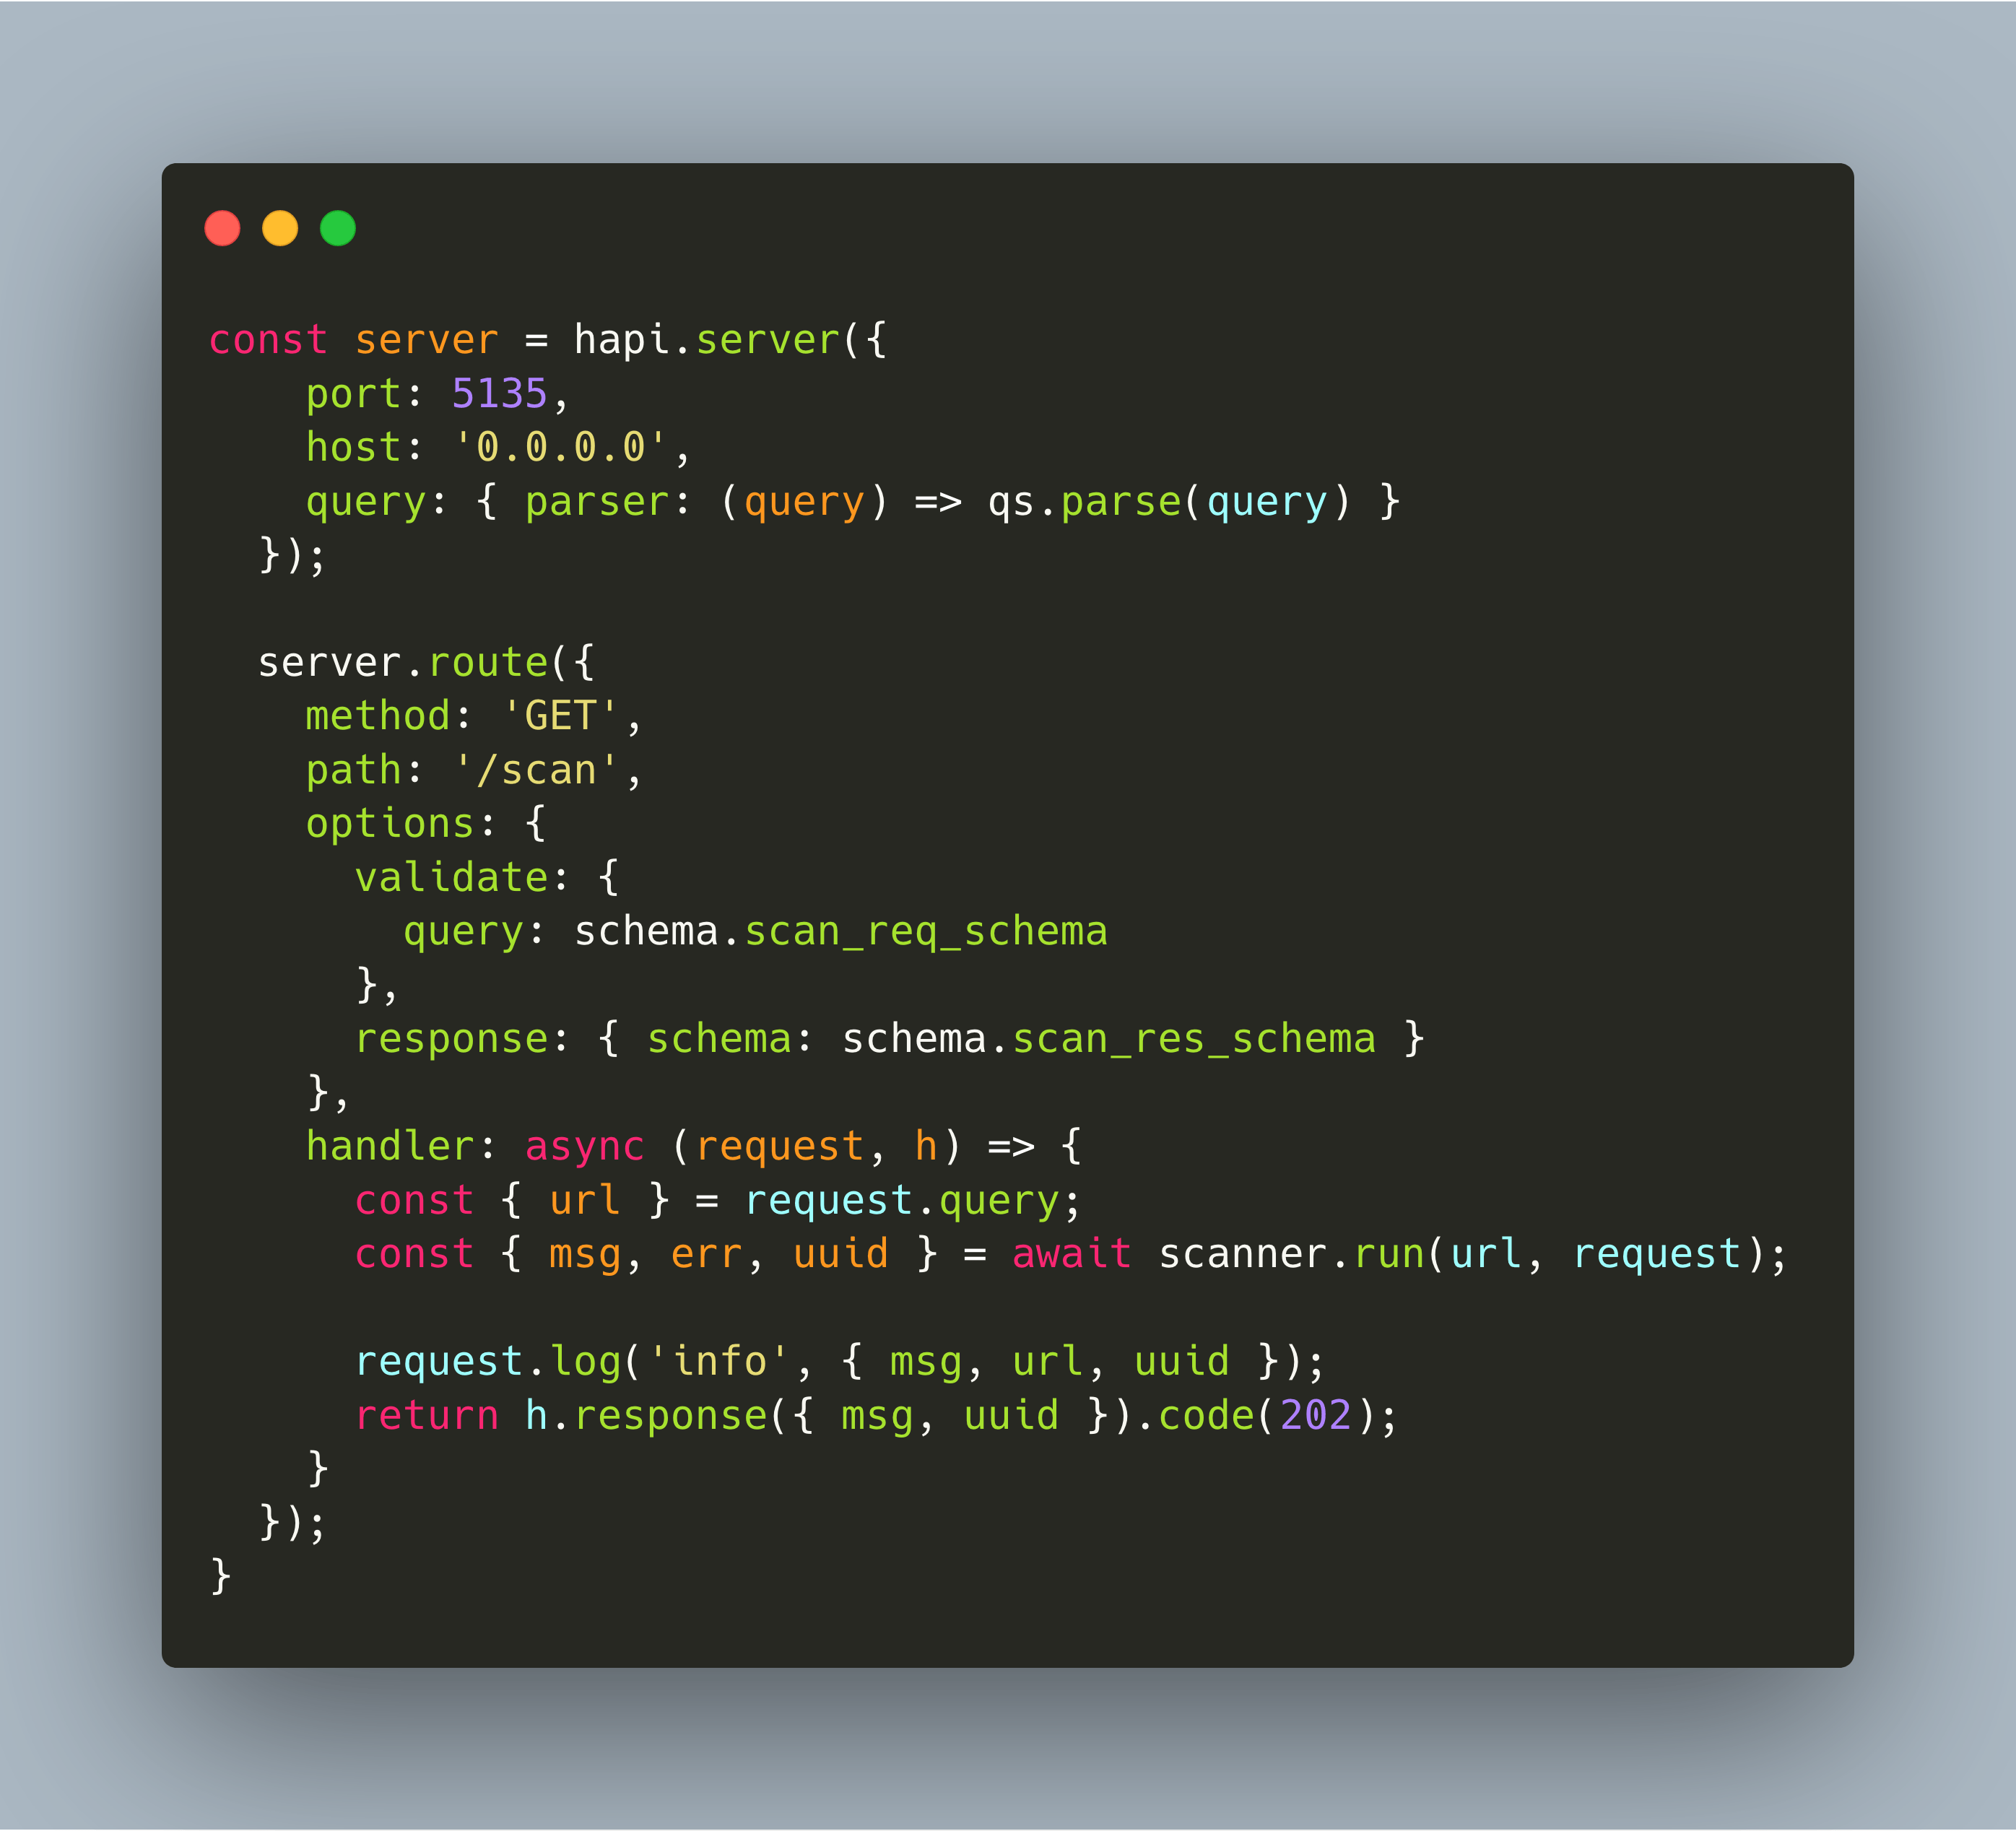
With my Lighthouse-as-a-Service website scanner you can quickly check a webpage about its performance, SEO and best practices. It is built with microservices. In my new article, I discuss Nodejs Microservice frameworks and show how to leverage the Hapi framework.
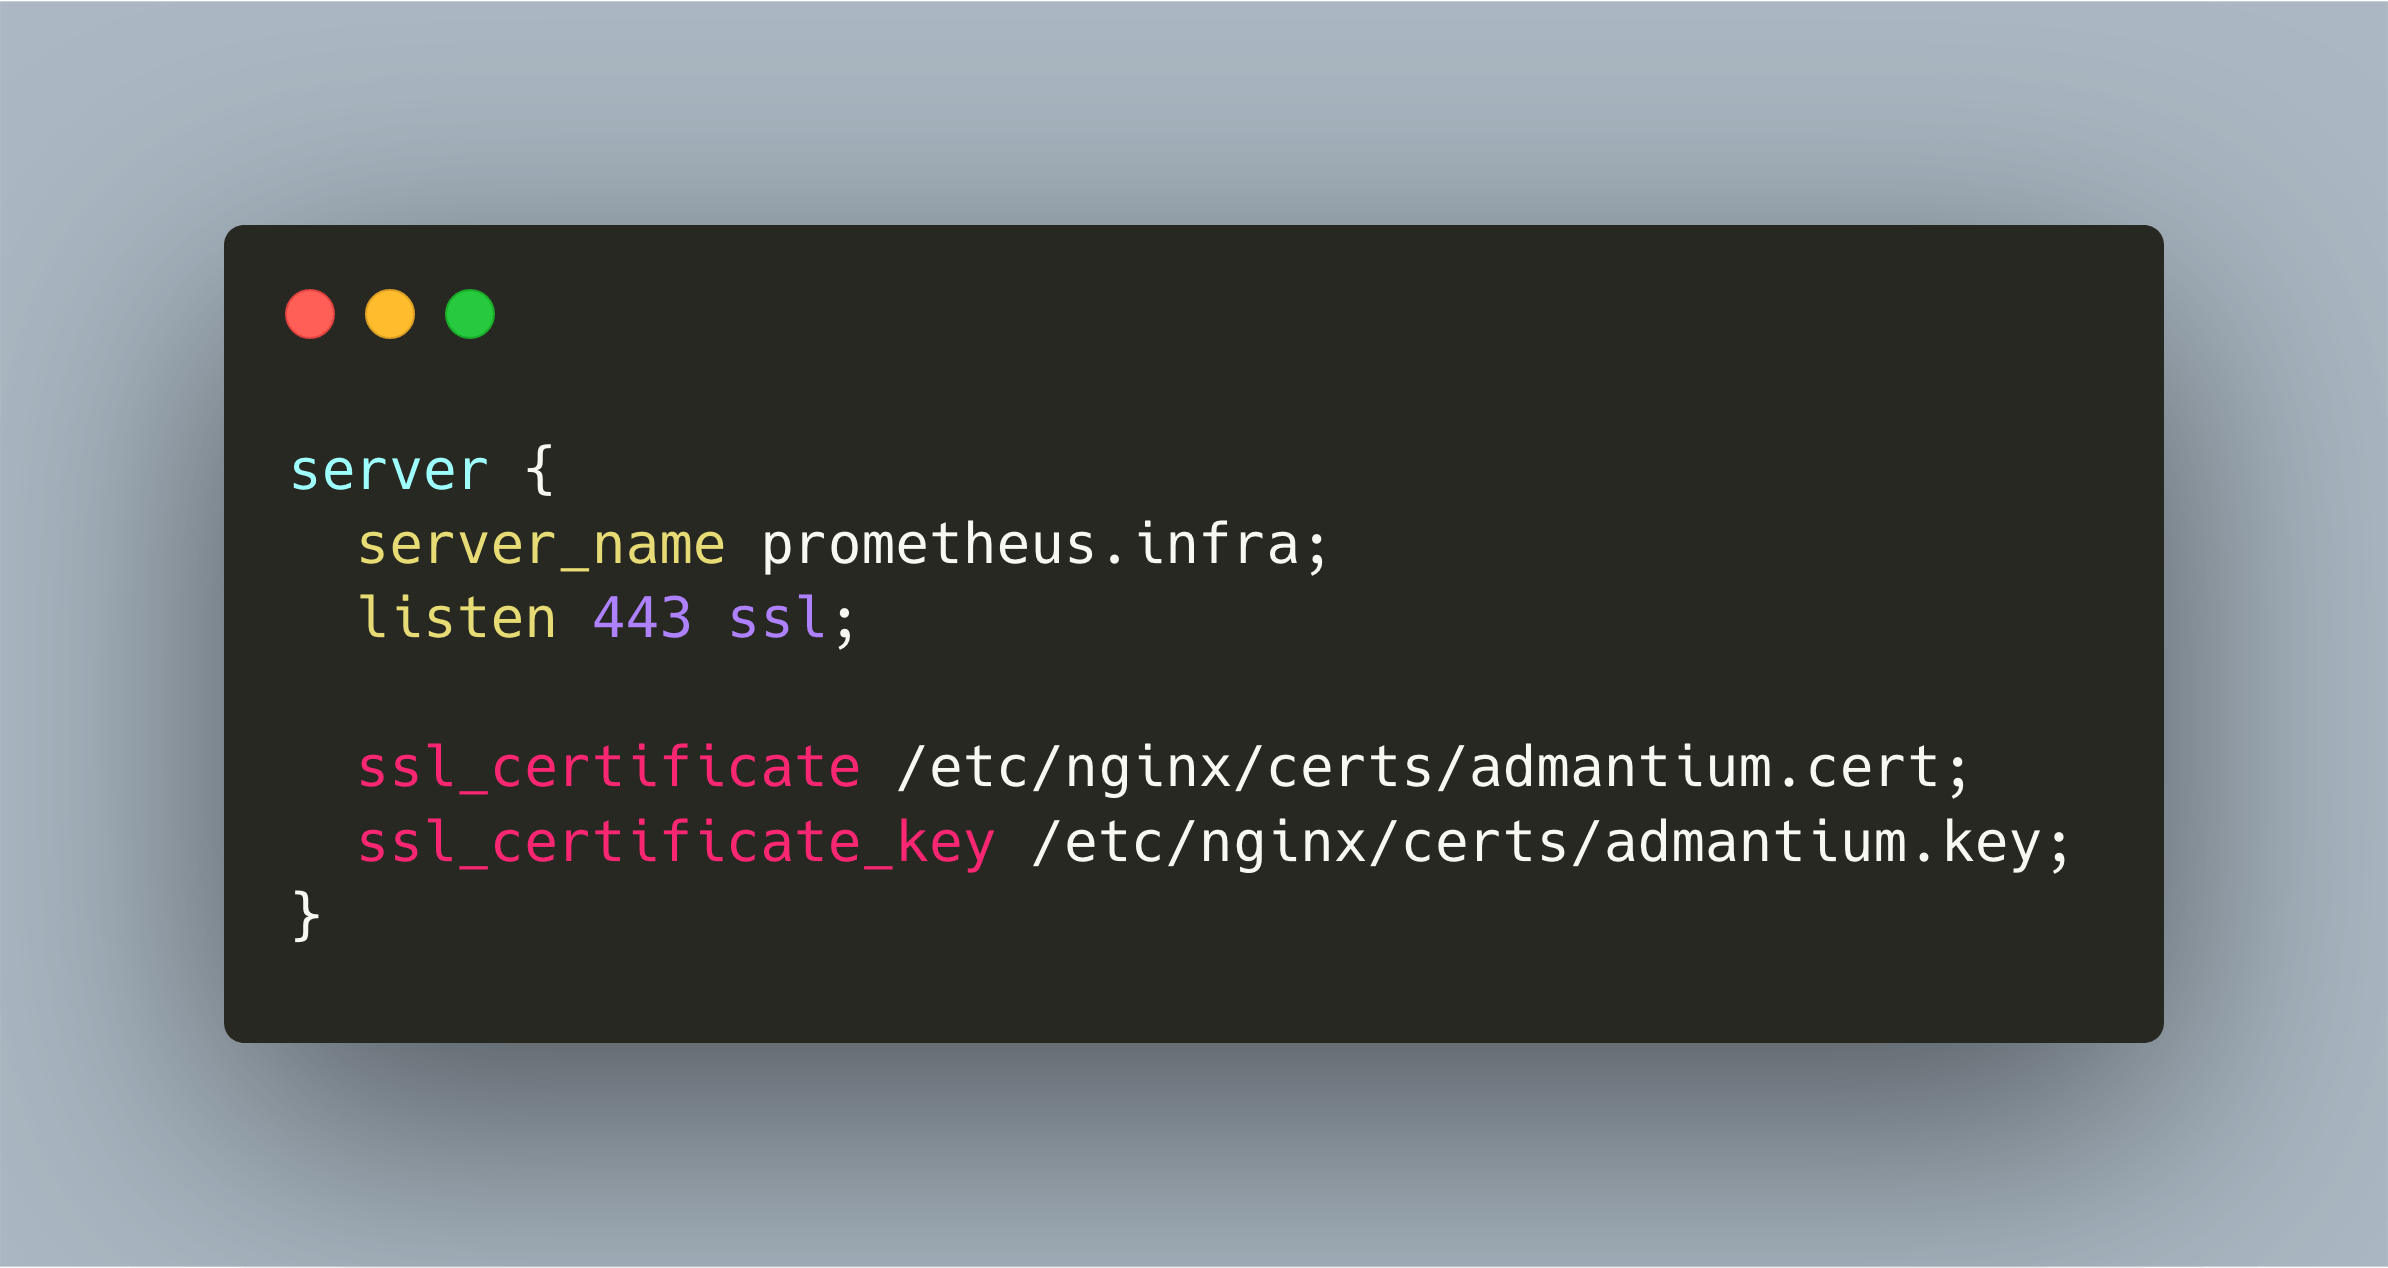
TLS encryption of traffic is a security must have. In this article, I show how to create and install a self-signed certificate, and how to configure Nginx for providing encryption to all ingress and egress traffic.
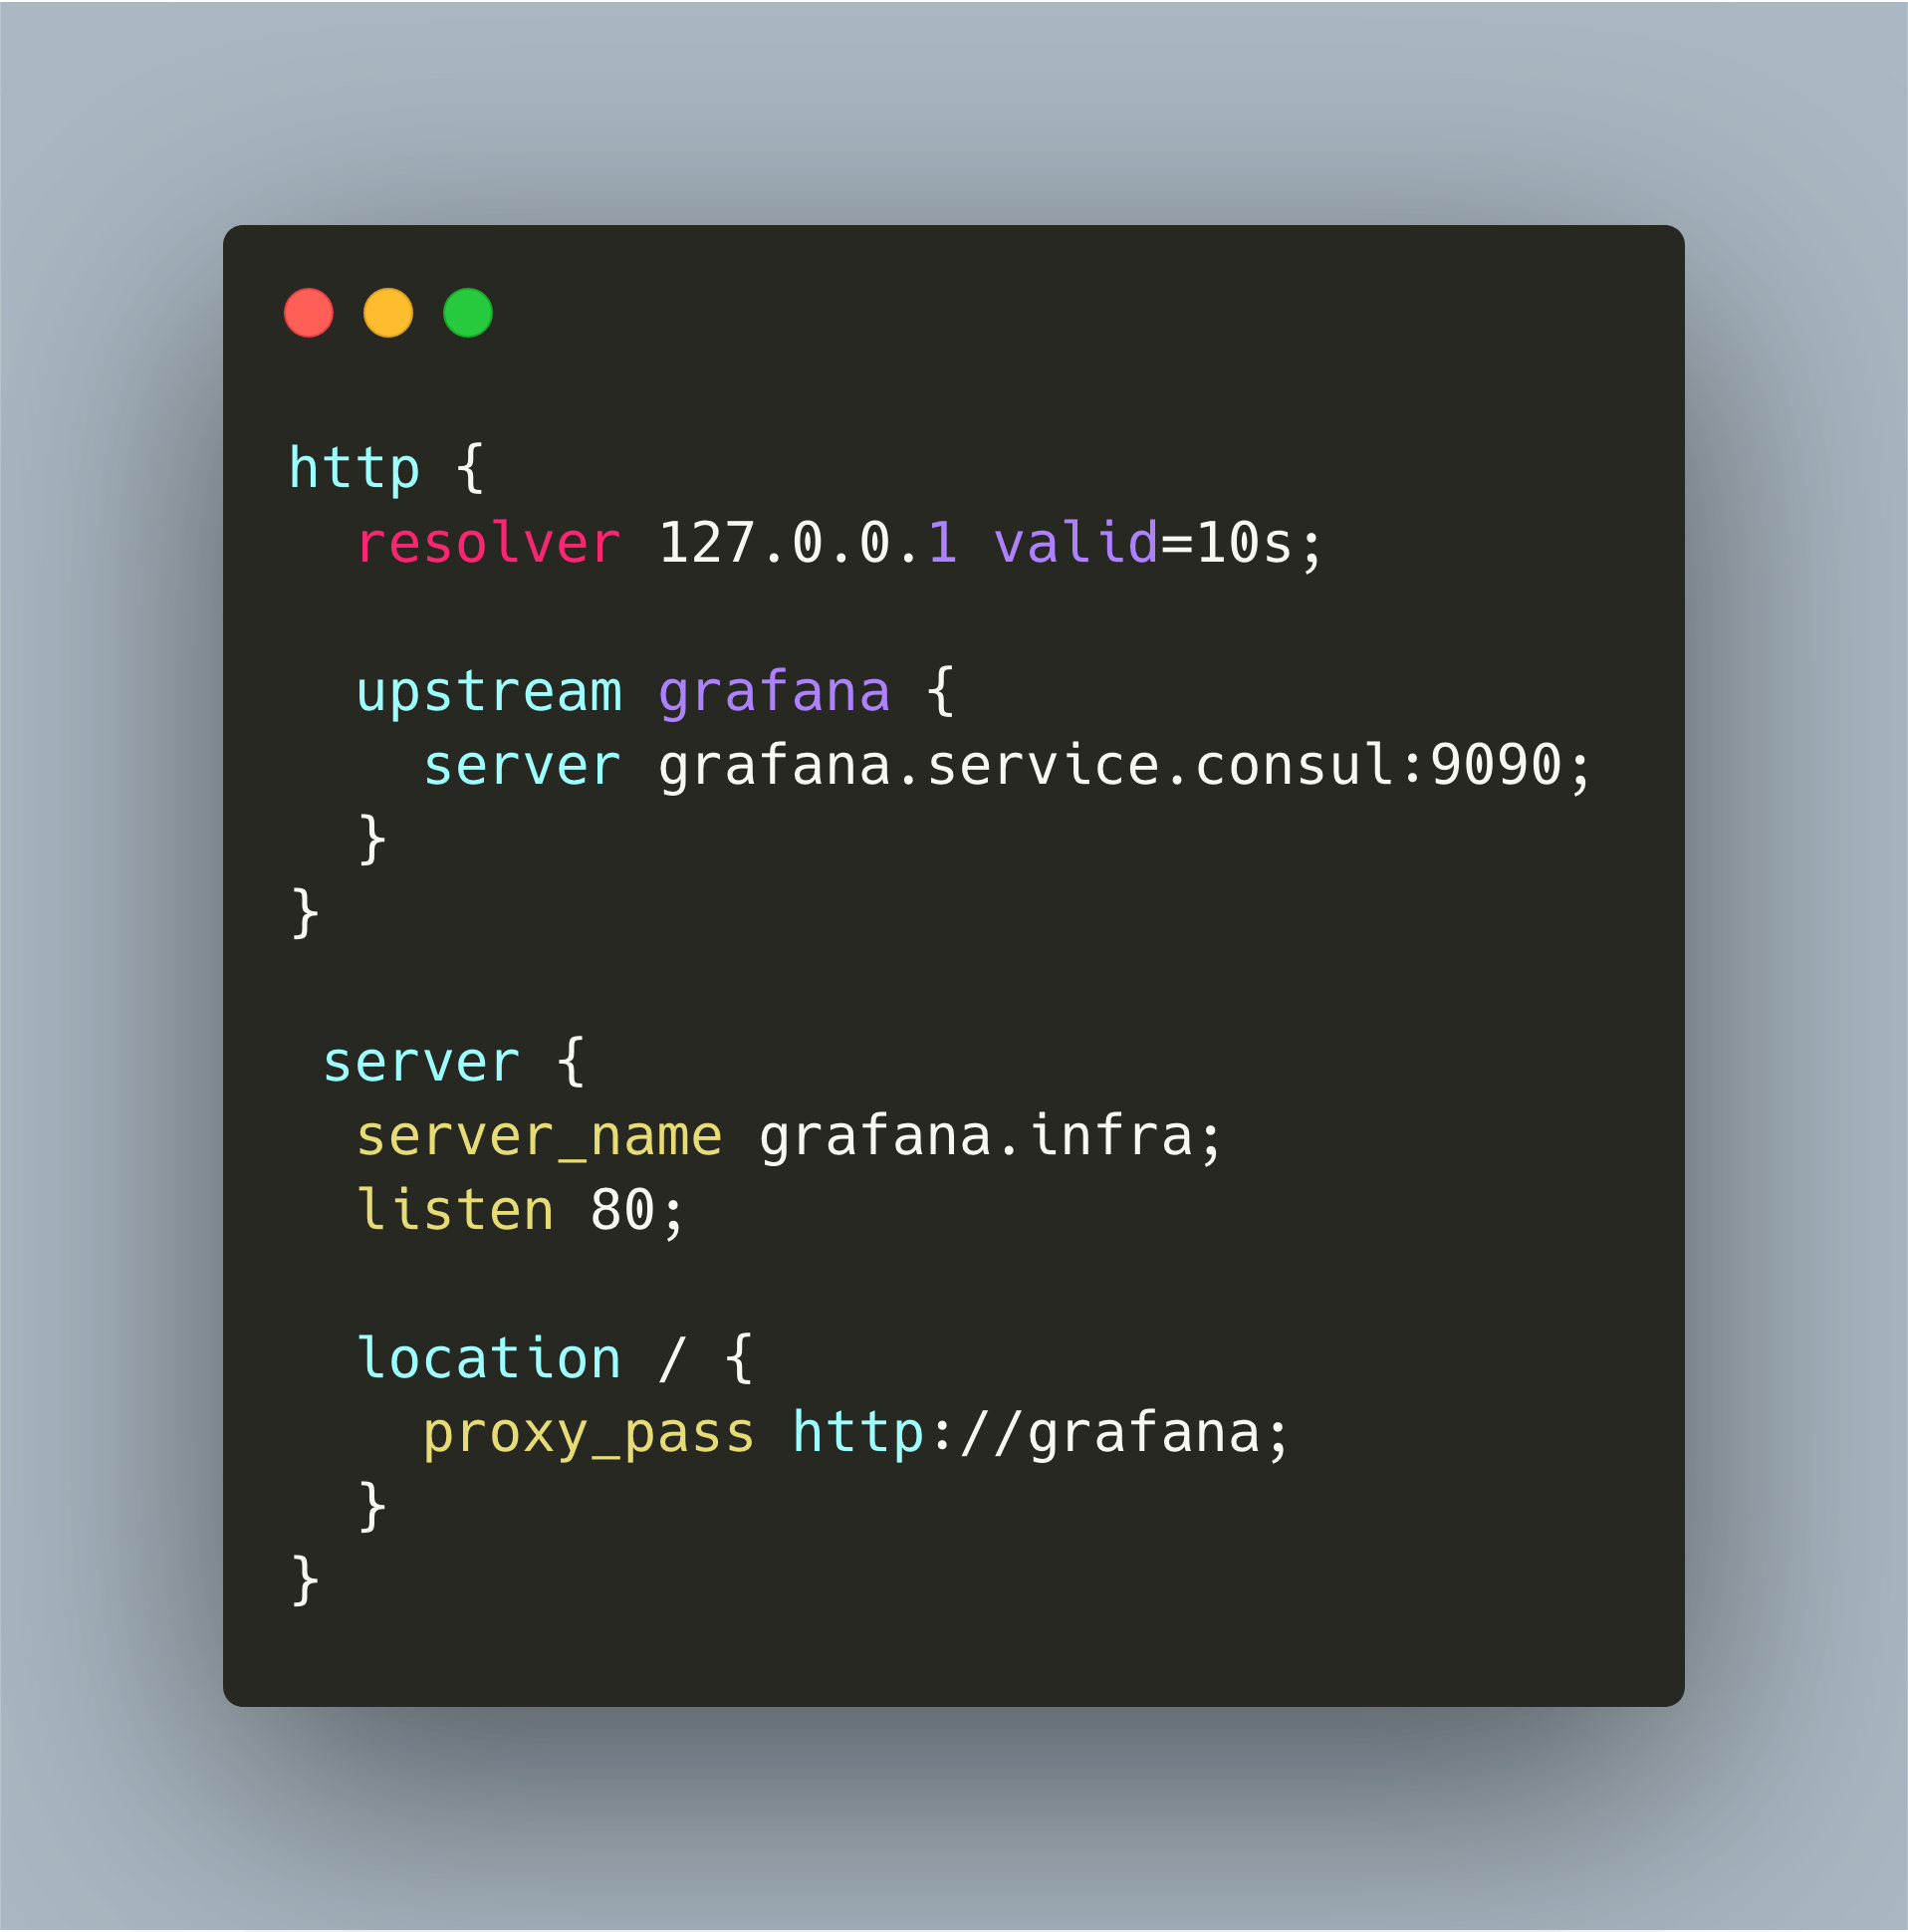
Nginx is a versatile tool: webserver, load balancer, reverse proxy. In this article, I show how to use Nginx as the central reverse proxy in your cloud that works with Consul and local DNS servers for providing well-known domain names of applications running in your cloud