In the last year, I setup a Kubernetes Cluster in the cloud. It hosts my blog and the two apps Lighthouse and ApiBlaze. Right in the middle of my holiday, I received a notification email that ApiBlaze is down, and then on Friday, also my blog and Lighthouse were not available anymore. This articles discusses how I approached the problem, found a solution, and what I learned.
Upptime Monitoring
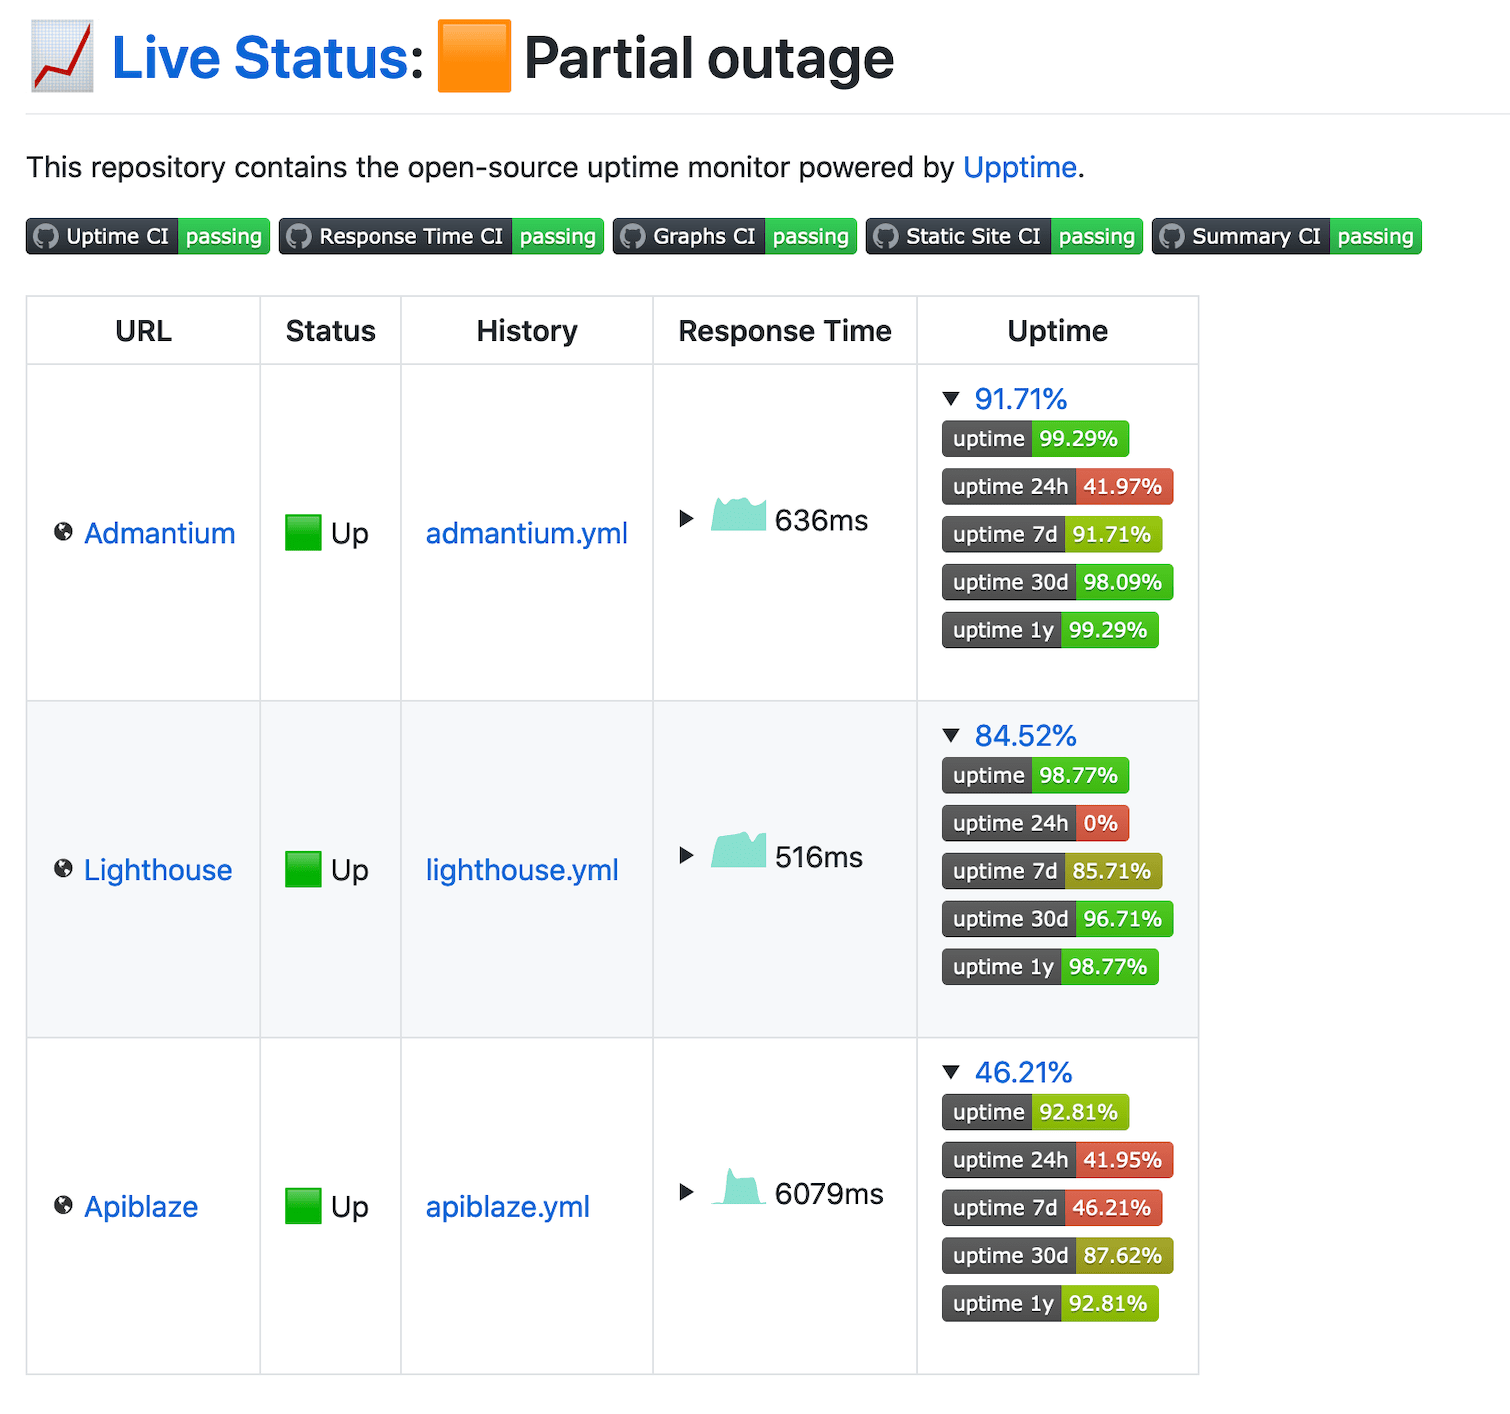
For the most part, I have monitored my applications with updown.io. When I ran out of the free plan credits, I switched to Upptime - basically out of curiosity to learn how Github tasks can be used to monitor your application. I was impressed how simple a public dashboard is created, and how you collect uptime metrics absolutely automatic without much configuration.
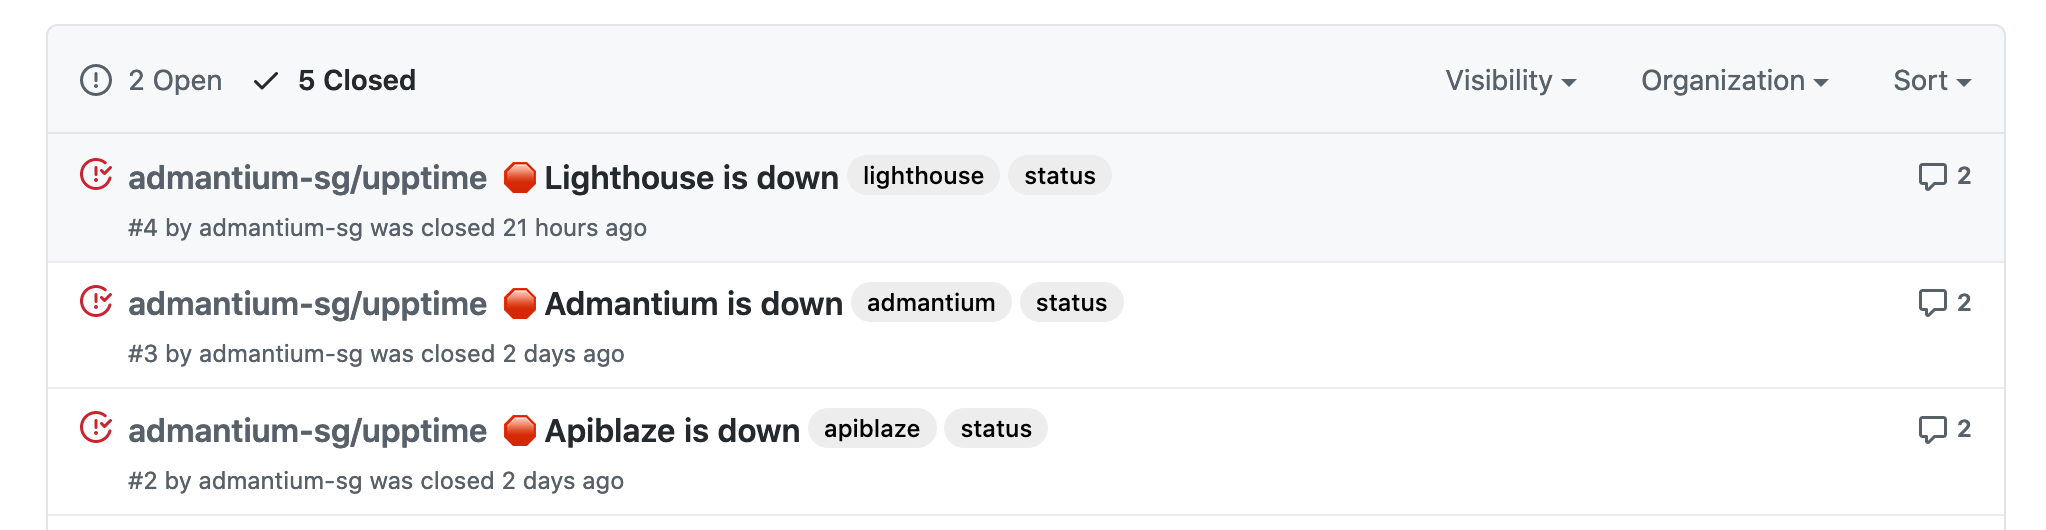
An additional feature of Upptime IO that I became aware of recently is its deep integration with Github. On the day that my services broke down, I did not only get a notification email, but also automatically a Github issue was created. These issues allow you to publicly communicate about an outage and to give users of your service a single point of information.
So at the end of my holiday week, I acknowledged the issues, and started to investigate the root causes.
Identify Current Status
The first step is to check the current status of your service. In my case, I’m running all my services with the Kubernetes distribution K3S - read my earlier blog post about this easy to setup, easy to use distribution.
To interact with the Kubernetes cluster, I work directly with the kubectl command line tool. So, I wanted to check the status of the Pods with kubectl get pods --all-namespaces and to see the events that were happening in the cluster with kubectl get events --all-namespaces. However, I could not connect to the cluster with my local machine: An error message (that I did not record) stated that the certificate to connect to the cluster is not valid anymore. Instead, I logged into my master node, ran the kubectl command there - they connect directly to the local running Kubernetes API, and therefore could be executed. I saw that all pods for my main applications were down.
But why?
Identify Problems
On the master node, running kubectl commands, I could identify several problems:
- The master node was quickly consuming all disk space. About 5Gb of system logfiles were written in the course of 24 hours - error messages from the Kubernetes system!
- The master node error messages indicated two problems: It could not communicate with the worker nodes to resolve K8S resources, and it could not schedule workload on its own machine or at the worker nodes.
- The master node hosted an instance of my blog - which it should not do, all application hosting should happen on the worker nodes
- The worker nodes had the status of
not ready, which means they were not reporting their status to the master node - The worker nodes Kubernetes log files showed several error messages, again I saw the “certificate is invalid” message. Apparently, because of an internal certificate problem, the nodes could not communicate with each other
The following picture summarizes my problem understanding:
- For some reason, Kubernetes internal node communication was disrupted
- All nodes produced massive amount of error messages, consuming disk space
- The master node started to schedule workloads on itself
Now, how do I resolve these issues? And what are my priorities?
Re-Enable Node Communication: 1st attempt
My priority was to get the applications online as quickly as possible. And therefore, fixing the inter-node communication so that workloads can be correctly scheduled again. This became my top priority - but it was wrong as we shall see…
My first attempt to get the worker nodes running normally was to restart the Kubernetes service. Using the systemctl restart k3s-agent command line utility on each worker nodes did not resolve the problem. The communication problems persisted, and I could see a very clear error message: Error: 'x509: certificate has expired or is not yet valid
Searching for this error in the context of Kubernetes and K3S, I found Github issues, blog posts, and stack overflow posts. Since these articles and post were often in the context of a very specific application, it was very hard to generalize the specific problems into a solution for my particular problem. Eventually - I really don’t have a better word for it - I found a hint to delete the central Coredns certificate of the Kubernetes control plane, and then to restart the Coredns pod so that a new certificate is generated. I followed this approach, and then …
Interception: No Disk Space Available
In the meantime, the error log messages on the master node piled up, and they actually completely clogged the whole disk space! I needed to manually delete log files and start log rotate to free up some space. Then, it also occurred to me that the error messages will be written at the same speed. And to solve this, I temporarily scaled all application deployments to 0 pods. The error messages stopped.
This is a crucial learning. I failed to recognize the immediate issue of running out of disk space while trying to make the cluster operational again. I ignored a tactical problem while working on the strategic challenge.
Ok, the master node is operational again, lets resolve the communications problem.
Re-Enable Node Communication: 2nd attempt
On the master node, I still could see a lot of pods in erroneous states: Some became evicted, others could not be scheduled because of missing resources. And actually, the Coredns pod could not be scheduled on the master node because it had not resources. I manually deleted non-essential pods from the node, and then the Coredns pod could be scheduled. A new certificate was generated too. This looks good.
On the worker nodes, I issued systemctl restart k3s-agent again. And very soon, the nodes were reported as ready again!
Cleanup
The next step is mundane, but necessary: Cleanup of all erroneous pods. At my work, we are using the excellent Lens UI app to manage Kubernetes. With this tool, I could get a much better overview. I cleaned up all broken pods.
Now I just need to scale up the deployments. But a crucial thing was missing: My private Docker registry that hosts the Docker images. For my private applications, I decided to not use a persisted volume with the registry. But the registry pod was gone - and so where all of its images. Therefore, I needed to re-build all images, upload them, and then scale the deployments.
During this step, I also modified each application deployment spec to prevent that they are scheduled on the master node again. This can be done with
a nodeAffinity configuration in the deployment spec as shown here:
apiVersion: apps/v1
kind: Deployment
metadata:
  # ...
spec:
  replicas: 1
  revisionHistoryLimit: 10
  selector:
    matchLabels:
      app: lighthouse-web
  template:
    spec:
      affinity:
        nodeAffinity:
          requiredDuringSchedulingIgnoredDuringExecution:
            nodeSelectorTerms:
              - matchExpressions:
                  - key: kubernetes.io/hostname
                    operator: In
                    values:
                      - k3s-node1
                      - k3s-node2
      containers:
        - name: lighthouse-web
          image: docker.admantium.com/lighthouse-web:0.3.1
          ...
After re-building all images and pushing them to the registry, my blog, lighthouse and ApiBlaze applications were finally reachable again.
Conclusion
In this article, I discussed the recent Kubernetes service outage of my blog and my apps Lighthouse and ApiBlaze - right in the middle of my holiday! This article reflects how I approached the problem, what steps I took, and how I finally restored all services. The learning was plenty and surprising. First of all, Upptime JS is an excellent, free to use mentoring tool with Github integration. When Upptime noticed that my services were down, it automatically created Github issues. I like the idea that my Github Repo is a public dashboard, and the issues communicated the downtime. Second, the investigation into Kubernetes outage uncovered several problems that I solved one after the other: Failed deployments to master, disk ran out of space, and the certificate error. After all of this, I’m impressed again about the robustness of Kubernetes. I also made and learned from the crucial mistake of solving the tactical problems first before the root problem - always stabilize your servers first, then the services. After some cleanup, and the time-consuming application building and Docker registry uploads, all services were working again.