The Raspberry Pico is a new microcontroller launched in February 2021. The community was excited about this new board, and several people started amazing projects. I grabbed two boards early on, and while still working on my Arduino based robot, did the usual blinking led and potentiometer tutorials. For simplicity, I used the MicroPython SDK. It is setup in minutes, simple sketches are easy, and you can live-connect to the Pico and execute your program.
If you want to use the C SDK, you have a lot to do: Install build tools, CMake, download the SDK, define an SDK path, then add CMake files for your projects, adding all the required libraries etc. And the comfort level at which you arrive is ok - you still need to compile and manually upload the UF2 file to the Pico.
Can it be better and simpler? Yes! Thanks to the great wizio-pico project, Visual Studio Code integration can be achieved, including direct upload to your Pico. And when you consider the pico-debug project, you can also integrate full debugging capabilities for your programs.
This blog pot continues the Pico setup series and will detail how to setup a fully working debugger in VS Studio Code. Keep in mind that ultimately the steps are based on explanations from pico-debug project, and wizio-pico, but the setup is complex so I wrote a summarizing blog article. Follow along and you will be debugging your Pico C programs with the press of a simple launch button.
Tool Overview
Before we arrive at the fully integrated debugging solution, it’s important to understand the tools that will do the heavy lifting for us.
The JTAG standard describes how to debug integrated circuits. The standard defines the communication protocol how the registers and bus systems on the circuits can be accessed. And it also describes the electrical interface, e.g. a serial port, to access the circuit. Instead of using a dedicated port, the SWD (Serial Wire Debug) protocol can use just two pins to interface with an ARM chip for debugging purposes. This standard is used by the tool OpenOCD, which is an acronym for On-Chip-Debugger. It uses the JTAG standard to establish a debugging session to an integrated circuit. Finally, the GNU Project Debugger GDB is an Open-Source workhorse for debugging applications, supporting C, C++ and others. GDB can connect to an OpenOCD session to start debugging. GDB itself is ultimately a CLI application, offering a dedicated language to load a program, set breakpoints and variables. Modern IDEs will interface with GDB and provide a powerful, visual debugging experience.
To use these tools, we need to setup a compiler that produces ARM code, GDB and OpenOCD. Let’s start!
Compiler & GDB
We need to install a cross-compiler that can produce ARM code: The gcc-arm-none-eabi. Execute the following command to install this compiler and other required tools.
$> sudo apt update
$> sudo apt install cmake gcc-arm-none-eabi libnewlib-arm-none-eabi build-essential
Test that these tools are installed correctly:
$> arm-none-eabi-gcc -v

Using built-in specs.
COLLECT_GCC=arm-none-eabi-gcc
COLLECT_LTO_WRAPPER=/usr/lib/gcc/arm-none-eabi/9.2.1/lto-wrapper
Target: arm-none-eabi
To install GDB:
apt install gdb-multiarch
And also, shortly test that it is correctly installed:
$> db-multiarch -v

GNU gdb (Ubuntu 9.2-0ubuntu1~20.04) 9.2
Copyright (C) 2020 Free Software Foundation, Inc.
License GPLv3+: GNU GPL version 3 or later <http://gnu.org/licenses/gpl.html>
OpenOCD
Following the pico-debug project explanations, we will install a special version of OCD that support the Raspberry Pico.
First we install regular Linux packages …
$> sudo apt install automake autoconf texinfo libtool libhidapi-dev libusb-1.0-0-dev
…and then we will clone a Git repository to compile and make the custom OCD version.
$> git clone https://github.com/majbthrd/openocd.git --recursive --branch rp2040_cmsisdap_demo --depth=1
$ cd openocd
$ ./bootstrap
$ ./configure --enable-cmsis-dap
$ make -j4
$ sudo make install
Again, we test that the installation is successful:
$> openocd -h

Open On-Chip Debugger 0.10.0+dev-gb4af1af-dirty (2021-03-21-10:40)
Licensed under GNU GPL v2
Preparing the Pico
With the toolchain installed and tested, we can continue to prepare the Pico itself. Again, two tasks need to be done:
- The Pico needs to be booted with a special UF2 image so that it can be used as a debugging device
- The target program needs to be compiled with a special debug compiler flag
Install the Debugging UF2 Image
First, grab the latest UF2 image from https://github.com/majbthrd/pico-debug/releases, then drag’n drop the file onto your mass storage mode mounted Pico. It will boot your raspberry Pico as a CMSIS-DAP device. This acronym stands for Cortex Microcontroller Software Interface Standard - Debug Access Port, which is both a protocol specification and a concrete firmware. Technically, it wraps the Picos’ Serial-Wire-Debug Interface and emulates a Debug Access Port (DAP) via USB. This standardized interface can be used by a connected host computer running a debugger.
Lets see if the image is processed correctly. When executing dmesg, you should see the following output:
[50852.541543] usb 1-2: new full-speed USB device number 70 using xhci_hcd
[50852.690691] usb 1-2: New USB device found, idVendor=1209, idProduct=2488, bcdDevice=10.02
[50852.690696] usb 1-2: New USB device strings: Mfr=0, Product=1, SerialNumber=0
[50852.690698] usb 1-2: Product: CMSIS-DAP
The Pico is ready. Now, we compile the program to be available for debugging.
Compile the target program
When i began to write the article, I hoped that you just needed to make a small switch in the plattform.ini file, compile and have a debug able version of your program. However, this is not the case yet. If you want to use just one Pico for debugging, you need to use a special SDK for compiling your program. This SDK fixes some issues with USB system initialization that otherwise interferes with debugging. You can read the details at the github thread.
Until a better solution is available, we need to add special CMake compilation files.
Lets picture the final directory layout that we will obtain:
.
├── debug
│   ├── build
│   ├── CMakeLists.txt
│   ├── pico-debug.uf2
│   ├── pico_sdk_import.cmake
│   └── src -> /home/work/development/pico2/src/
├── include
│   ├── pico
│   │   └── config_autogen.h
│   └── README
├── lib
│   └── README
├── LICENSE.txt
├── platformio.ini
├── README.md
├── src
│   ├── CMakeLists.txt
│   └── main.c
└── test
    └── README
The concrete steps are
- Create the directories
buildanddebug - In
debug, copy the special uf2 files, and add a symbolic link to thesrcdirectory - In
debug, put thisCMakeLists.txtfile into it.
cmake_minimum_required(VERSION 3.12)

# Pull in SDK (must be before project)
include(pico_sdk_import.cmake)

project(pico_examples C CXX ASM)
set(CMAKE_C_STANDARD 11)
set(CMAKE_CXX_STANDARD 17)

set(PICO_EXAMPLES_PATH ${pwd})

# Initialize the SDK
pico_sdk_init()

add_subdirectory(src)
- In
src/folder, add thisCMakeLists.txtfile.
add_executable(main
        main.c
        )

# Pull in our pico_stdlib which pulls in commonly used features
target_link_libraries(main pico_stdlib)

# create map/bin/hex file etc.
pico_add_extra_outputs(main)
Now we can compile the program.
- Set the environment variable
PICO_SDK_PATHto point to the special SDK
export PICO_SDK_PATH=/home/work/development/pico-debug-sdk/
- Go to the
debug/buildfolder, and run the following commands:
cmake -DCMAKE_BUILD_TYPE=Debug -g0 ..
The compilation process should start and show an output like follows:
Using PICO_SDK_PATH from environment ('/home/work/development/pico-debug-sdk/')
PICO_SDK_PATH is /home/work/development/pico-debug-sdk
Defaulting PICO_PLATFORM to rp2040 since not specified.
Defaulting PICO platform compiler to pico_arm_gcc since not specified.
PICO compiler is pico_arm_gcc
PICO_GCC_TRIPLE defaulted to arm-none-eabi
-- The C compiler identification is GNU 9.2.1
-- The CXX compiler identification is GNU 9.2.1
-- The ASM compiler identification is GNU
-- Found assembler: /usr/bin/arm-none-eabi-gcc
Using regular optimized debug build (set PICO_DEOPTIMIZED_DEBUG=1 to de-optimize)
Defaulting PICO target board to pico since not specified.
Using board configuration from /home/work/development/pico-debug-sdk/src/boards/include/boards/pico.h
-- Found Python3: /usr/bin/python3.8 (found version "3.8.5") found components: Interpreter
TinyUSB available at /home/work/development/pico-debug-sdk/lib/tinyusb/src/portable/raspberrypi/rp2040; adding USB support.
Compiling TinyUSB with CFG_TUSB_DEBUG=1
-- Found Doxygen: /usr/bin/doxygen (found version "1.8.17") found components: doxygen dot
ELF2UF2 will need to be built
-- Configuring done
-- Generating done
-- Build files have been written to: /home/work/development/pico2/debug/build
- In the
buildfolder, you will now seesrc- change into this directory, and executemake
cd src/
make
You should see this output:
Scanning dependencies of target ELF2UF2Build
[  1%] Creating directories for 'ELF2UF2Build'
[  3%] No download step for 'ELF2UF2Build'
[  5%] No patch step for 'ELF2UF2Build'
[  6%] No update step for 'ELF2UF2Build'
[  8%] Performing configure step for 'ELF2UF2Build'
-- The C compiler identification is GNU 9.3.0
-- The CXX compiler identification is GNU 9.3.0
...
-- Build files have been written to: /home/work/development/pico2/debug/build/elf2uf2
[ 10%] Performing build step for 'ELF2UF2Build'
Scanning dependencies of target elf2uf2
[ 50%] Building CXX object CMakeFiles/elf2uf2.dir/main.cpp.o
[100%] Linking CXX executable elf2uf2
[100%] Built target elf2uf2
[ 11%] No install step for 'ELF2UF2Build'
[ 13%] Completed 'ELF2UF2Build'
[ 13%] Built target ELF2UF2Build
Scanning dependencies of target bs2_default
[ 15%] Building ASM object pico-sdk/src/rp2_common/boot_stage2/CMakeFiles/bs2_default.dir/boot2_w25q080.S.obj
[ 16%] Linking ASM executable bs2_default.elf
...
[100%] Linking CXX executable main.elf
[100%] Built target main
Done! You now have a debugable version of you program that can run on just one connected Pico.
Debugging on the CLI
We have installed the toolchain. We have prepared the Pico. Now, we can start the debugging process. In this section, we will directly use the CLI tools. In the next section, we will integrate these tools into Visual Studio Code.
OpenOCD: Executing as Normal User
In order to run OpenOCD as a normal user, we need to create an OpenOCD launch file, and add your normal user to a special group. The reference for these steps is this stackexchange post.
Create the file /etc/udev/rules.d/98-openocd.rules and add this content:
ACTION!="add|change", GOTO="openocd_rules_end"
SUBSYSTEM!="usb|tty|hidraw", GOTO="openocd_rules_end"
ATTRS{product}=="*CMSIS-DAP*", MODE="664" GROUP="plugdev"
LABEL="openocd_rules_end"
Then, create a new Linux group, and add your personal user to that group.
$> sudo groupadd plugedev
$> sudo gpasswd -a devcon plugdev
$> sudo udevadm control --reload
Like before, we test this. See that your user is a member of the newly created group
$> groups
devcon adm dialout cdrom sudo dip plugdev lpadmin lxd sambashare
Start OpenOCD
Now we manually start the OpenOCD server. In the same directory in which you build it, execute this command:
$> cd openocd/tcl
$> openocd -f interface/cmsis-dap.cfg -f target/rp2040-core0.cfg -c "transport select swd" -c "adapter speed 4000"
If you are as curious as me about what this command means:
- The two
-fflags indicate loading of configuration files, here we load the Debug Access Port (DAP) config and a config for the Pico board (RP2040) - The two
-cflags indicate additional commands that are run, we will connect via serial wire debug and set the connection speed in kHz between the host and the Pico.
You should see this output:
Open On-Chip Debugger 0.10.0+dev-gb4af1af-dirty (2021-03-21-10:40)
Licensed under GNU GPL v2
For bug reports, read
 http://openocd.org/doc/doxygen/bugs.html
swd
adapter speed: 4000 kHz

Info : Hardware thread awareness created
Info : RP2040 Flash Bank Command
Info : Listening on port 6666 for tcl connections
Info : Listening on port 4444 for telnet connections
Info : CMSIS-DAP: SWD  Supported
Info : CMSIS-DAP: FW Version = 2.0.0
Info : CMSIS-DAP: Interface Initialized (SWD)
Info : SWCLK/TCK = 0 SWDIO/TMS = 0 TDI = 0 TDO = 0 nTRST = 0 nRESET = 0
Info : CMSIS-DAP: Interface ready
Info : clock speed 4000 kHz
Info : SWD DPIDR 0x0bc12477
Info : SWD DLPIDR 0x00000001
Info : rp2040.core0: hardware has 4 breakpoints, 2 watchpoints
Info : starting gdb server for rp2040.core0 on 3333
Info : Listening on port 3333 for gdb connections
Open a second terminal window, and navigate to the directory in which you compiled your Pico project. Then we will launch a GDB session.
$> cd debug/build/src
$> gdb-multiarch main.elf
You should see this output:
gdb-multiarch main.elf
GNU gdb (Ubuntu 9.2-0ubuntu1~20.04) 9.2
Copyright (C) 2020 Free Software Foundation, Inc.
License GPLv3+: GNU GPL version 3 or later <http://gnu.org/licenses/gpl.html>
This is free software: you are free to change and redistribute it.
There is NO WARRANTY, to the extent permitted by law.
Type "show copying" and "show warranty" for details.
This GDB was configured as "x86_64-linux-gnu".
Type "show configuration" for configuration details.
For bug reporting instructions, please see:
<http://www.gnu.org/software/gdb/bugs/>.
Find the GDB manual and other documentation resources online at:
    <http://www.gnu.org/software/gdb/documentation/>.

For help, type "help".
Type "apropos word" to search for commands related to "word"...
Reading symbols from src/main.elf...
With the GDB session open, we can now execute commands to perform the debugging. GDB has an elaborate language, we will focus on the main commands to drive a simple console-based debugging session.
(gdb) target remote localhost:3333
Remote debugging using localhost:3333
main () at /home/work/development/pico2/debug/src/main.c:37
37 int main() {
(gdb) load
Loading section .boot2, size 0x100 lma 0x10000000
Loading section .text, size 0x4b10 lma 0x10000100
Loading section .rodata, size 0xd84 lma 0x10004c10
Loading section .binary_info, size 0x20 lma 0x10005994
Loading section .data, size 0xa04 lma 0x100059b4
Start address 0x100001e8, load size 25528
Transfer rate: 8 KB/sec, 4254 bytes/write.
(gdb) monitor reset init
target halted due to debug-request, current mode: Thread
xPSR: 0xf1000000 pc: 0x000000ee msp: 0x20041f00
(gdb) b main
Breakpoint 1 at 0x100003d8: file /home/work/development/pico2/debug/src/main.c, line 37.
(gdb) c
Continuing.
Note: automatically using hardware breakpoints for read-only addresses.

Breakpoint 1, main () at /home/work/development/pico2/debug/src/main.c:37
37 int main() {
(gdb) n
38     setup();
(gdb) n
40     printf("Hello World\n");
(gdb) n
43         printf(".");
(gdb) n
44         blink();
(gdb) n
42     while (true) {
(gdb) p LED_GREEN
$1 = 15
(gdb)
If you came this far, it’s only a few steps more to setup debugging with your IDE.
Install additional VsCode extensions
C/C++ Extension Pack (by Microsoft)
Cortex-Debug (by marus25)
CMake Tools (by Microsoft)
Create the file .vscode/launch.json, and enter this content:
{
  "version": "0.2.0",
  "configurations": [
    {
      "name": "Pico Debug",
      "device": "RP2040",
      "gdbPath": "gdb-multiarch",
      "cwd": "${workspaceRoot}",
      "executable": "${workspaceRoot}/debug/build/src/main.elf",
      "request": "launch",
      "type": "cortex-debug",
      "servertype": "openocd",
      "configFiles": ["interface/cmsis-dap.cfg", "target/rp2040-core0.cfg"],
      "openOCDLaunchCommands": ["transport select swd", "adapter speed 4000"],
      "svdFile": "${env:PICO_SDK_PATH}/src/rp2040/hardware_regs/rp2040.svd",
      "searchDir": ["/home/work/development/openocd/tcl"],
      "runToMain": true,
      "postRestartCommands": ["break main", "continue"]
    }
  ]
}
The important things to change are:
executable: Needs to point to the debug-ready compiled filesvdFile: SVD is a file format containing the specifics of a microcontroller, this file is used by openocd to provide hardware related debugging information like registers etc.serachDir: Configure this to your OpenOCD installations tcl path
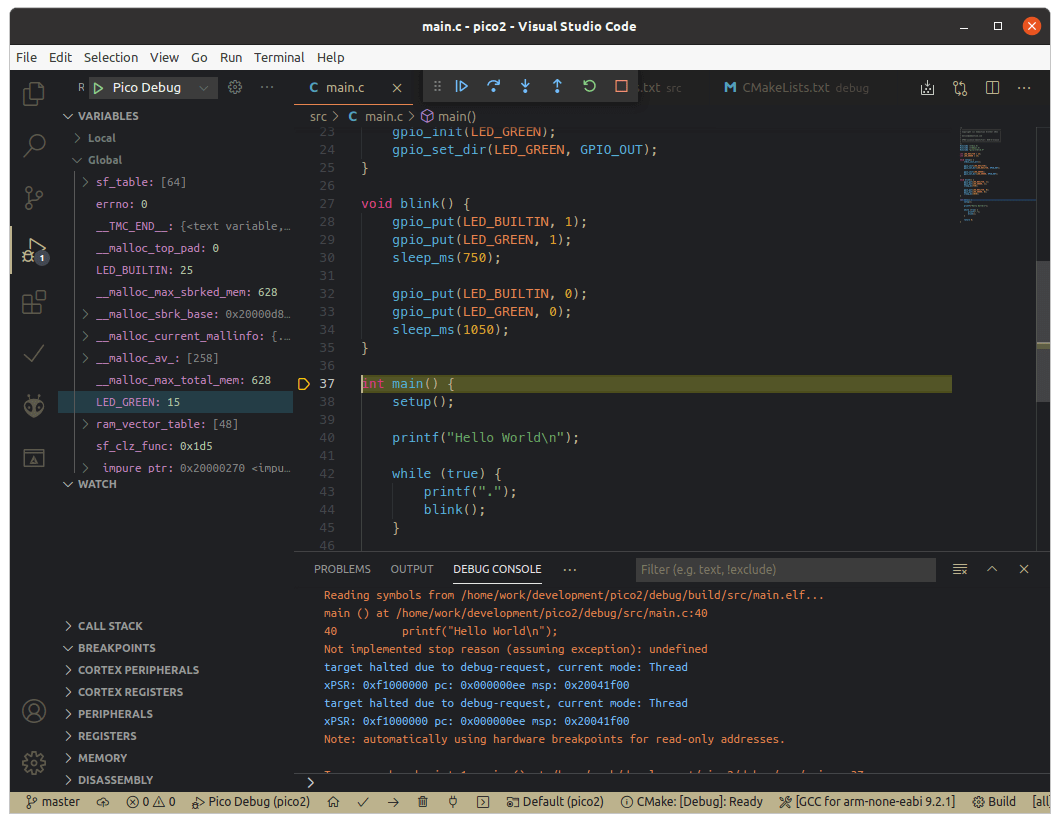
And now comes the final moment. in VS Code, click on Run/Start Debugging, and a few seconds later you should see the following window:

With all the comfort of your IDE, you can now debug.
Conclusion
This blog post took out way longer in several aspects: The time to write it, the time to test all the options, and the length of this article. With all the setup done, you can write your Pico programs in an integrated IDE, have all the comfort of code highlighting, browsing library functions, and refactoring options. Also, with the one-click-and-upload feature, you can program almost like with an Arduino. And on top of that, you can compile a Debug version of your program and run the debugger from within Visual Studio Code. This should greatly enhance your development effectiveness.
To help you get started with future projects, check out my pico-project-setup repo on Github.