Home Assistant (HA) is a versatile solution to manage IOT boards and their sensors. It helps to facilitate data collection and provide user friendly home automation. In its default configuration, HA will store every state change in its own internal SQLite database. Yet for IOT developers, using and working with timeseries database, like InfluxDB, is the norm. Can we use HA to store sensor data in a timeseries DB as well? Short answer: Yes. Long answer: Yes, but HA makes explicit, not configurable convention how and what to save, so check the details...
This article is a complete manual to the setup, structure, and usage of Home Assistant time series database features. You will see how to enable HA to write data to a custom InfluxDB, see examples how the data is structured, and learn how to use customize the stored data with aggregations and retention policies.
The technical context of this article is Home Assistant 2022.11 and ESPHome 2022.11.3, but it should work with newer versions as well.
Configure InfluxDB for Home Assistant
Let’s head back a step before we start. When you collect sensor data and have a running Home Assistance instance, there are actually two options. The first option is to explicitly configure an MQTT connection per board, and an MQTT publisher for each sensor data that you want to record. But as the name implies, this is needed for all boards and all sensors. Individually. Each of them. The second option, and what is explored in this article, is to automatically mirror each status update that Home Assistant registers to Influx DB. This does not only prevent above consequences, but standardizes the measurements and record just everything that is a sensor or state-based entity.
To enable the InfluxDB connection, the official documentation explains to add the following settings to the configuration.yaml file of your home assistant installation. For clarification, lets split this into two parts: The connection settings, which identify the host name, port, database name, and the measurements setup, which define how measurements are named, which tags to use, and also which entities should be included or excluded in the database.
influxdb:
  ### Connection Setting ###
  api_version: 2
  ssl: false
  host: influxdb
  port: 8086
  bucket: home_assistant

  ### measurements setup ###
  tags:
    source: ha
  tags_attributes:
    - friendly_name
  default_measurement: units
  exclude:
    entities:
      - zone.home
    domains:
      - persistent_notification
      - person
  include:
    domains:
      - sensor
      - binary_sensor
      - sun
    entities:
      - weather.home
Then you need to restart the home assistant process or service. In my case, this is a docker container that I need to enable again.
> docker-compose restart home_assistant
> docker-compose logs -f home_assistant
To ensure that the configuration is applied correctly, check the logs files:
home_assistant    | 2022-01-16 12:15:04 ERROR (MainThread) [homeassistant.config] Invalid config for [influxdb]: token and bucket are required when api_version is 2 for dictionary value @ data['influxdb']. Got OrderedDict([('api_version', 2), ('ssl', False), ('host', 'influxdb'), ('port', 8086), ('bucket', 'home_assistant'), ('tags', OrderedDict([('source', 'ha')])), ('tags_attributes', ['friendly_name']), ('default_measurement', 'units')]). (See /config/configuration.yaml, line 14). Please check the docs at https://www.home-assistant.io/integrations/influxdb
home_assistant    | 2022-01-16 12:15:04 ERROR (MainThread) [homeassistant.setup] Setup failed for influxdb: Invalid config.
If you see this, you are running an InfluxDB version earlier than 2.0, and therefore need to change the connection settings as follows:
influxdb:
  host: influxdb
  port: 8086
  database: home_assistant
  username: ''
  password: ''
  ssl: false
  verify_ssl: false
  max_retries: 3
  default_measurement: state
And from here on, the specified InfluxDB database/bucket will be populated with recorded values.
Overview of Measurement Databases
Let’s consider how this data is structured. Connect to the InfluxDB with your favorite tool and explore.
> show measurements
name: measurements
name
----
%
IAQ
V
dBm
h
hPa
m
ms
ppm
s
state
°C
Ω
>
The first surprise is the name of the measurements: They are the measured units themselves! Let’s make sense of them first.
| Measurement Name | Unit | Explanation |
|---|---|---|
| % | Percentage | Battery Percentage Levels |
| IAQ | Air Quality Index | Calculated by the BME680 |
| V | Volt | Battery Voltage Levels |
| dBm | Decibel Milliwatts | Wireless Connection Strength |
| h | Hour | Measurements and state changes that report in time |
| hPa | Hectopascal | Air pressure from the BME680 sensor |
| m | Minutes | Records the setting of a dynamic sleep time for my boards |
| ppm | particles per million | Measures the number of particles of CO2 |
| state | Misc | All state changes of any sensor are recorded in this measurement |
| °C | Celsius | Temperature measurements |
| Ω | Electrical Resistance | The electrical resistance measurements of the BME680 sensor, used to calculate the IAQ |
Ok, lets investigate the structure of the measurements tables themselves. First, a measurement of a value, and then let’s take a look into the state measurements.
Structure of Measurement Databases
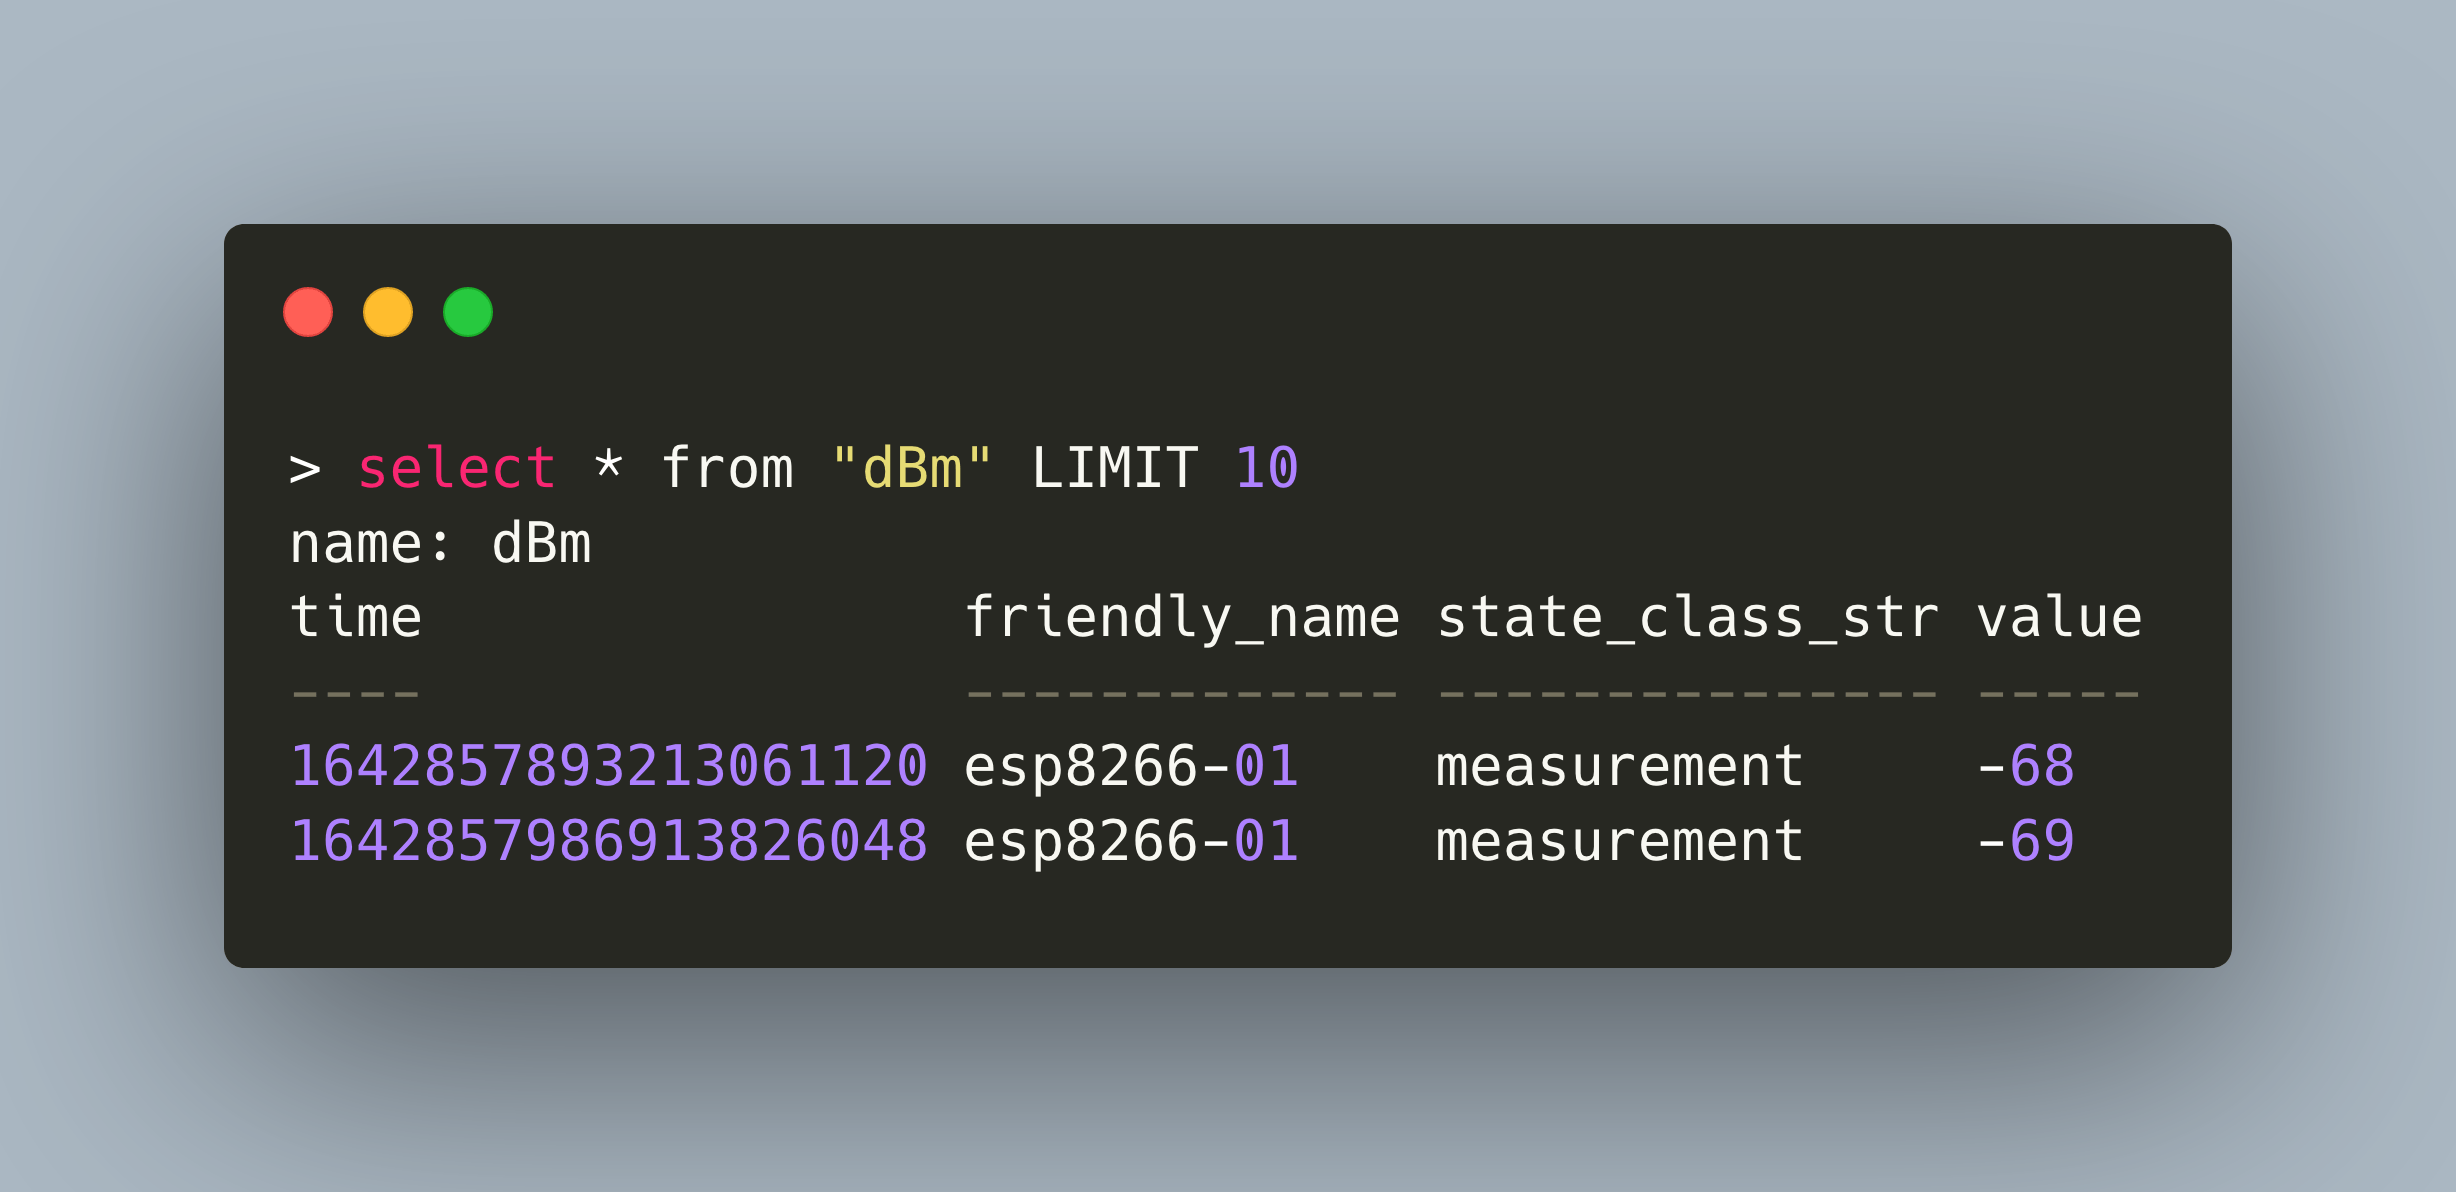
The measurements themselves are structured very similar:
> select * from "dBm" LIMIT 10
name: dBm
time                device_class_str domain entity_id              friendly_name friendly_name_str      state_class_str value
----                ---------------- ------ ---------              ------------- -----------------      --------------- -----
1642857893213061120 signal_strength  sensor wifi_signal_esp8266_01 826601        WiFi Signal esp8266-01 measurement     -68
1642857986913826048 signal_strength  sensor wifi_signal_esp8266_01 826601        WiFi Signal esp8266-01 measurement     -69
1642858046926774016 signal_strength  sensor wifi_signal_esp8266_01 826601        WiFi Signal esp8266-01 measurement     -71
1642858106919809024 signal_strength  sensor wifi_signal_esp8266_01 826601        WiFi Signal esp8266-01 measurement     -70
The table columns are this:
| Key | Type | Description |
|---|---|---|
| time | Epoch | measurements timestamp |
| device_class_str | String | HAs type of the measurement, for example "°C" refers to temperature, and "dBm" to signal strength |
| domain | String | Domains form the logical structure or origins of values, for example "sensor" or "light" |
| entity_id | String | The id of the entity |
| friendly_name | Integer | An internal ID for the friendl_name_str |
| friendly_name_str | String | User configurable alternative name for the device, can be used instead of its internal ID |
| icon_str | String | Names the icon that the HA dashboards assigns to this value |
| state_class_str | String | The origin of the data, here its always "measurement" |
| value | * | The concrete measured value |
Structure of the State Database
This special database keeps track of all state changes in your Home Assistant installation. Its structure is dependent on the number of entities that you have integrated – more sensors simple mean more columns in this database.
Here is the database when I just started with Home Assistant:
> select * from state limit 1

name: state
time                access_token access_token_str device_class_str domain editable entity_id entity_id_str                                      entity_picture_str friendly_name friendly_name_str icon_str id            latitude longitude newest_version_str passive radius release_notes_str state   supported_color_modes_str supported_features value
----                ------------ ---------------- ---------------- ------ -------- --------- -------------                                      ------------------ ------------- ----------------- -------- --            -------- --------- ------------------ ------- ------ ----------------- -----   ------------------------- ------------------ -----
1642332817702238976                                                scene           new_scene ['camera.esp32camera', 'light.esp32_camera_light']                                  New Scene                  1636879982536                                                                        scening
And here the state at the time of writing, when new temperature sensors, motion sensors and LED lights were added.
select * from "state" Limit 1
name: state
time                access_token access_token_str azimuth brightness color_mode_str current device_class_str domain editable effect_list_str effect_str elevation entity_id entity_id_str                                      entity_picture_str friendly_name friendly_name_str hs_color_str icon_str id            initial_str last_triggered last_triggered_str latitude longitude max message_str min mode_str newest_version_str next_dawn next_dawn_str next_dusk next_dusk_str next_midnight next_midnight_str next_noon next_noon_str next_rising next_rising_str next_setting next_setting_str passive pattern_str radius release_notes_str rgb_color rgb_color_str rising state   step supported_color_modes_str supported_features title_str value xy_color_str
----                ------------ ---------------- ------- ---------- -------------- ------- ---------------- ------ -------- --------------- ---------- --------- --------- -------------                                      ------------------ ------------- ----------------- ------------ -------- --            ----------- -------------- ------------------ -------- --------- --- ----------- --- -------- ------------------ --------- ------------- --------- ------------- ------------- ----------------- --------- ------------- ----------- --------------- ------------ ---------------- ------- ----------- ------ ----------------- --------- ------------- ------ -----   ---- ------------------------- ------------------ --------- ----- ------------
1642332817702238976                                                                                          scene                                                new_scene ['camera.esp32camera', 'light.esp32_camera_light']                                  New Scene                               1636879982536                                                                                                                                                                                                                                                                                                                                                                scening
As you see, those are a lot of values, but most of them will be filed only for very specific state changes. Let’s view them with a concrete example: Setting an LED light to on.
| name | state | description |
|---|---|---|
| tags | ||
| time (UTC) | 1644753700955780000 | Timestamp of the state change |
| access_token | ||
| access_token_str | ||
| azimuth | ||
| brightness | 31 | The brightness value specific for this LED |
| color_mode_str | rgb | A string representing how color are addressed |
| current | ||
| device_class_str | ||
| domain | light | The domain light |
| editable | ||
| effect_list_str | ['None', 'Rainbow', 'Pulse'] | Names of effects configured for the LED |
| effect_str | None | |
| elevation | ||
| entity_id | rgb_led_ring | The entity ID |
| entity_id_str | ||
| entity_picture_str | ||
| friendly_name | ||
| friendly_name_str | RGB LED Ring | The given friendly name |
| hs_color_str | (14.717, 62.353) | Hue and saturation values |
| icon_str | ||
| id | ||
| initial_str | ||
| last_triggered | ||
| last_triggered_str | ||
| latitude | ||
| longitude | ||
| max | ||
| message_str | ||
| min | ||
| mode_str | ||
| newest_version_str | ||
| next_daw | ||
| next_dawn_str | ||
| next_dusk | ||
| next_dusk_str | ||
| next_midnight | ||
| next_midnight_str | ||
| next_noon | ||
| next_noon_str | ||
| next_rising | ||
| next_rising_str | ||
| next_setting | ||
| next_setting_str | ||
| passive | ||
| pattern_str | ||
| radius | ||
| release_notes_str | ||
| rgb_color | 25513596 | Short notation for the configured RGB colors |
| rgb_color_str | (255, 135, 96) | Long notation for the configured RGB colors |
| rising | ||
| state | on | The effective state change |
| step | ||
| supported_color_modes_str | ['rgb'] | Color modes to address this LED |
| supported_features | 44 | Internal IDs of the features |
| title_str | ||
| value | 1 | A boolean value representing the state change |
| xy_color_str | (0.552, 0.346) | The x-y colorfulness |
With this understanding, lets visualize the data.
Grafana Dashboard for Sensor Measurements
The visualization of the InfluxDB data give us a nice conundrum. On the one hand, Home Assistant will provide sensor visualization for all data collected in its own database. This is handy and required no configuration. On the other hand, you can add any InfluxDB data Home assistant Dashboard cards too [^1]. But should you do this when the default visualization is available out of the box?
For all my other InfluxDB data, which is mainly hardware metrics from my Linux workstations and Raspberry Pi, I already use a Grafana dashboard. Therefore, I want to add a new Grafana dashboard to visualize the Home Assistant sensor data stored in InfluxDB.
The first graph can be setup in a matter of minutes:
- Configure the InfluxDB home assistant DB. From the Grafana main view, go to "Configuration" => "Data Sources", then click on "New Data Source". Here, enter the URL and Port to your InfluxDB server, and in the field database, type
home_assistant - Create a new dashboard, e.g. called "Home Assistant Sensor".
- Create a new Panel in the Dashboard: Select the Home Assistant InfluxDB data source, and a rich Query Editor UI is being shown. Here, select the measurements you are interested in and the mean value.
With this, you will receive a graph. But it may happen that you see multiple, duplicate values for the same timestamp and data. This happens when you configure the same entity with multiple integrations, for example reading temperature data with both the ESPHome API and an MQTT integration.
Let’s consider the following example: Multiple temperature measurements from the same sensor, but with different entity_id values.
name time (UTC) device_class_str domain entity_id friendly_name friendly_name_str state_class_str value
°C  1644341442651680000 temperature sensor bme680_temperature 680 BME680 Temperature  measurement 8.6
°C  1644341442671660000 temperature sensor bme680_temperature_2 680
BME680 Temperature  measurement 8.6
°C  1644343135338740000 temperature sensor bme680_temperature_2 680 BME680 Temperature  measurement 8.9
You have several options to approach this data duplicity problem. On the far hand, you could delete entries from the database that have the same timestamp and a different entity id. Or you could use a custom retention policy that filters and aggregates the data as you need at. And on the simpler side, if you are just interested in visualization, you can use a custom SELECT statements that combines multiple data points into averages.
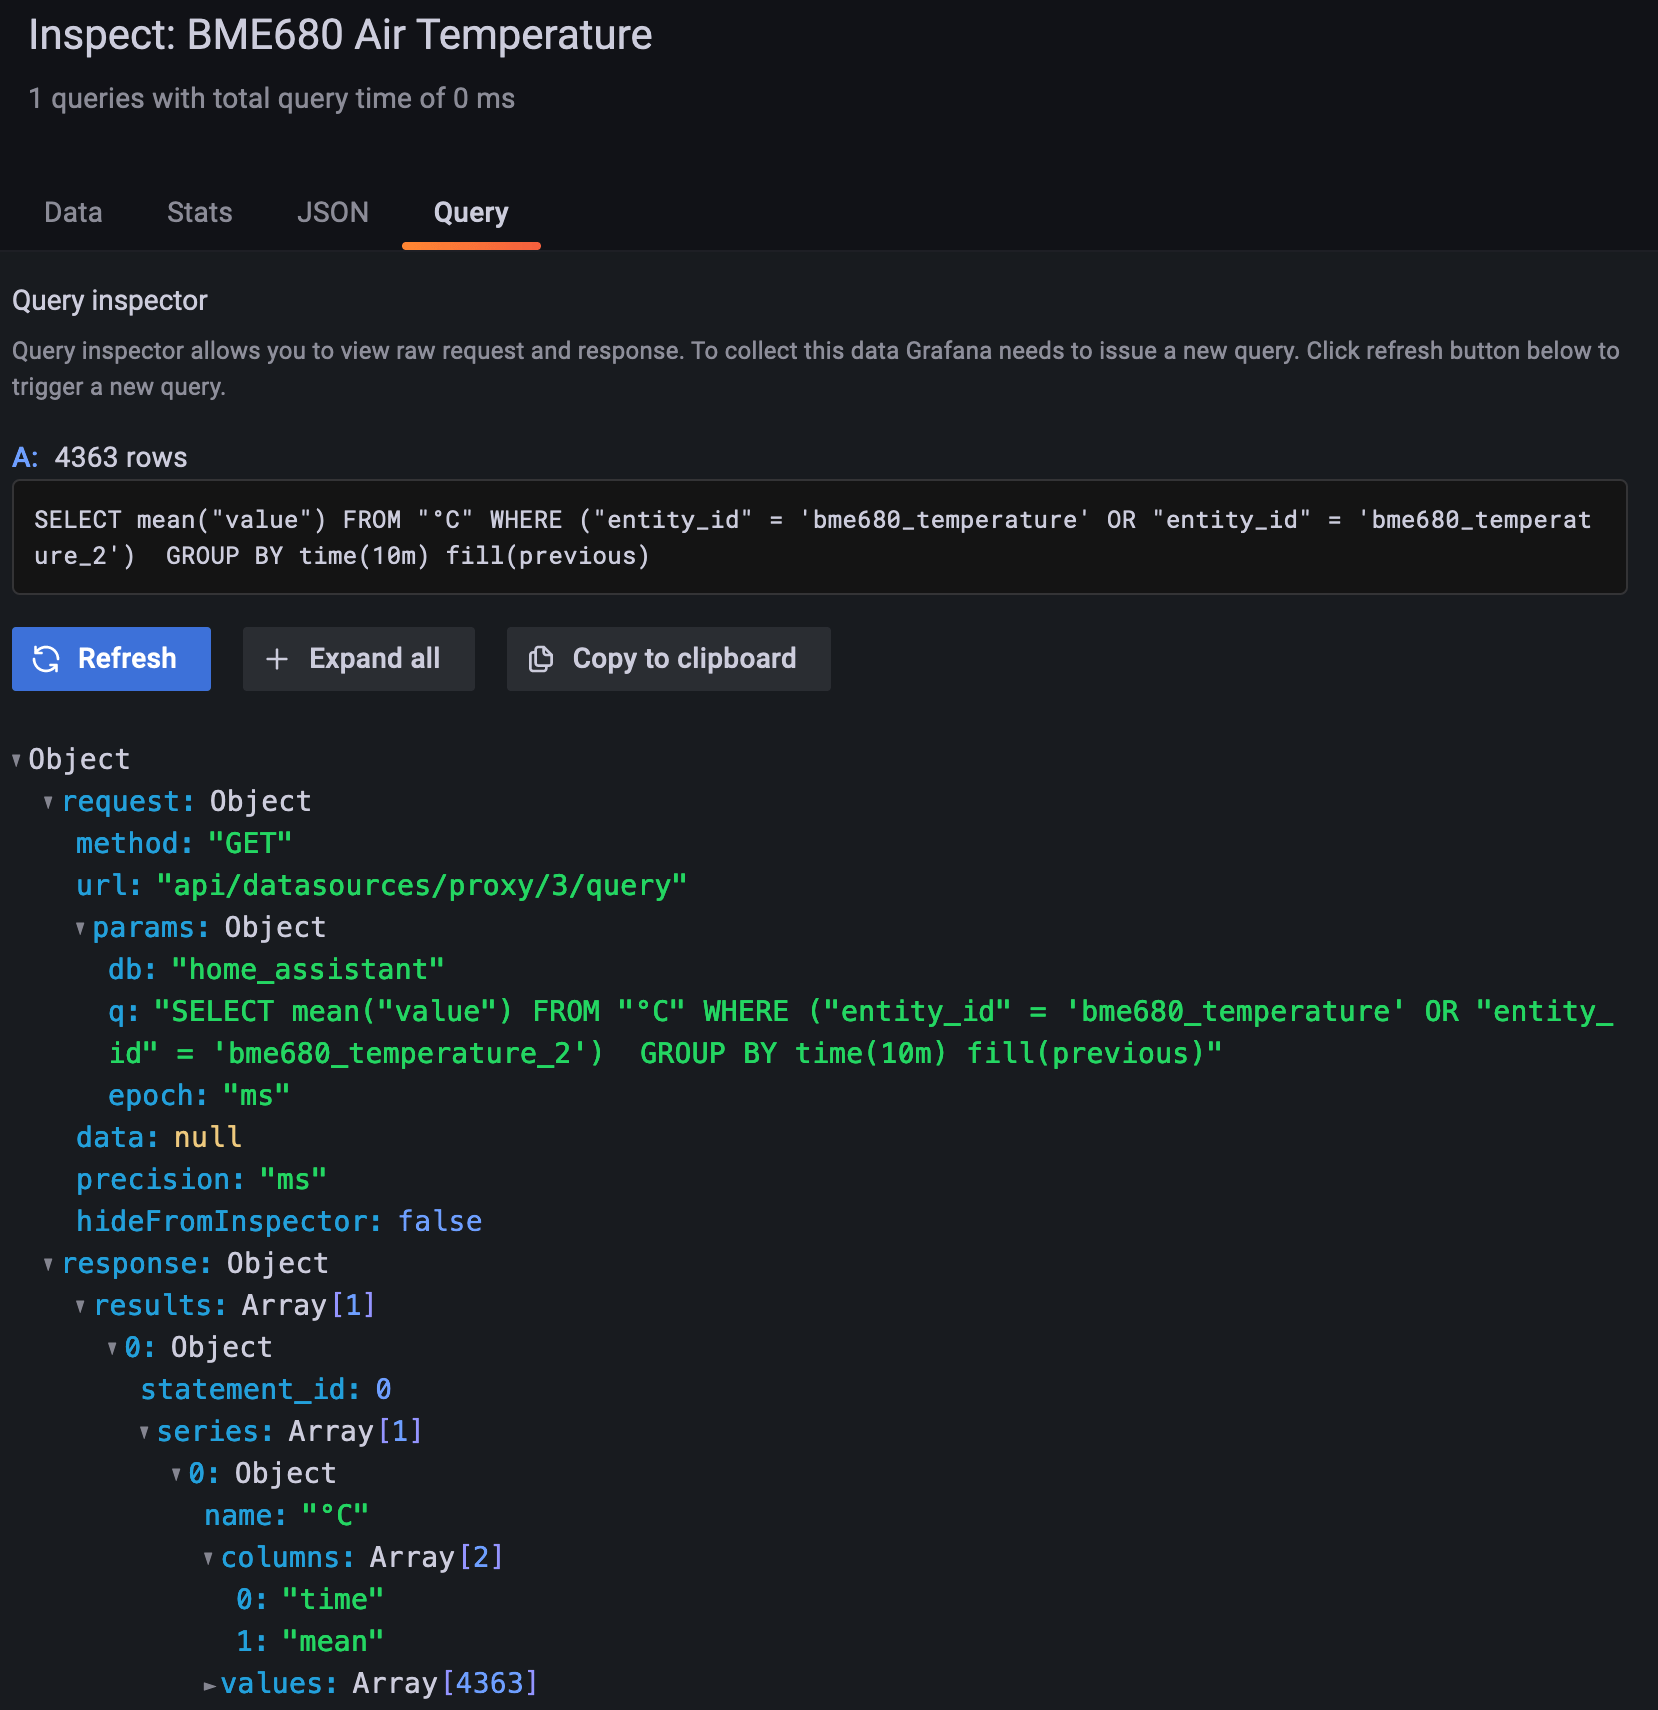
At the time of writing this article, I was still adding new devices and entities to Home Assistant, and therefore could not rule out that further duplicate entitles appeared. Therefore, I choose the simplest solution and created a custom query to average the data over a timespan of 10 minutes. The query is this:
SELECT mean("value")
FROM "°C"
WHERE ("entity_id" = 'bme680_temperature' OR "entity_id" = 'bme680_temperature_2')
GROUP BY time(10m) fill(previous)
The query inspector returned the values as requested:

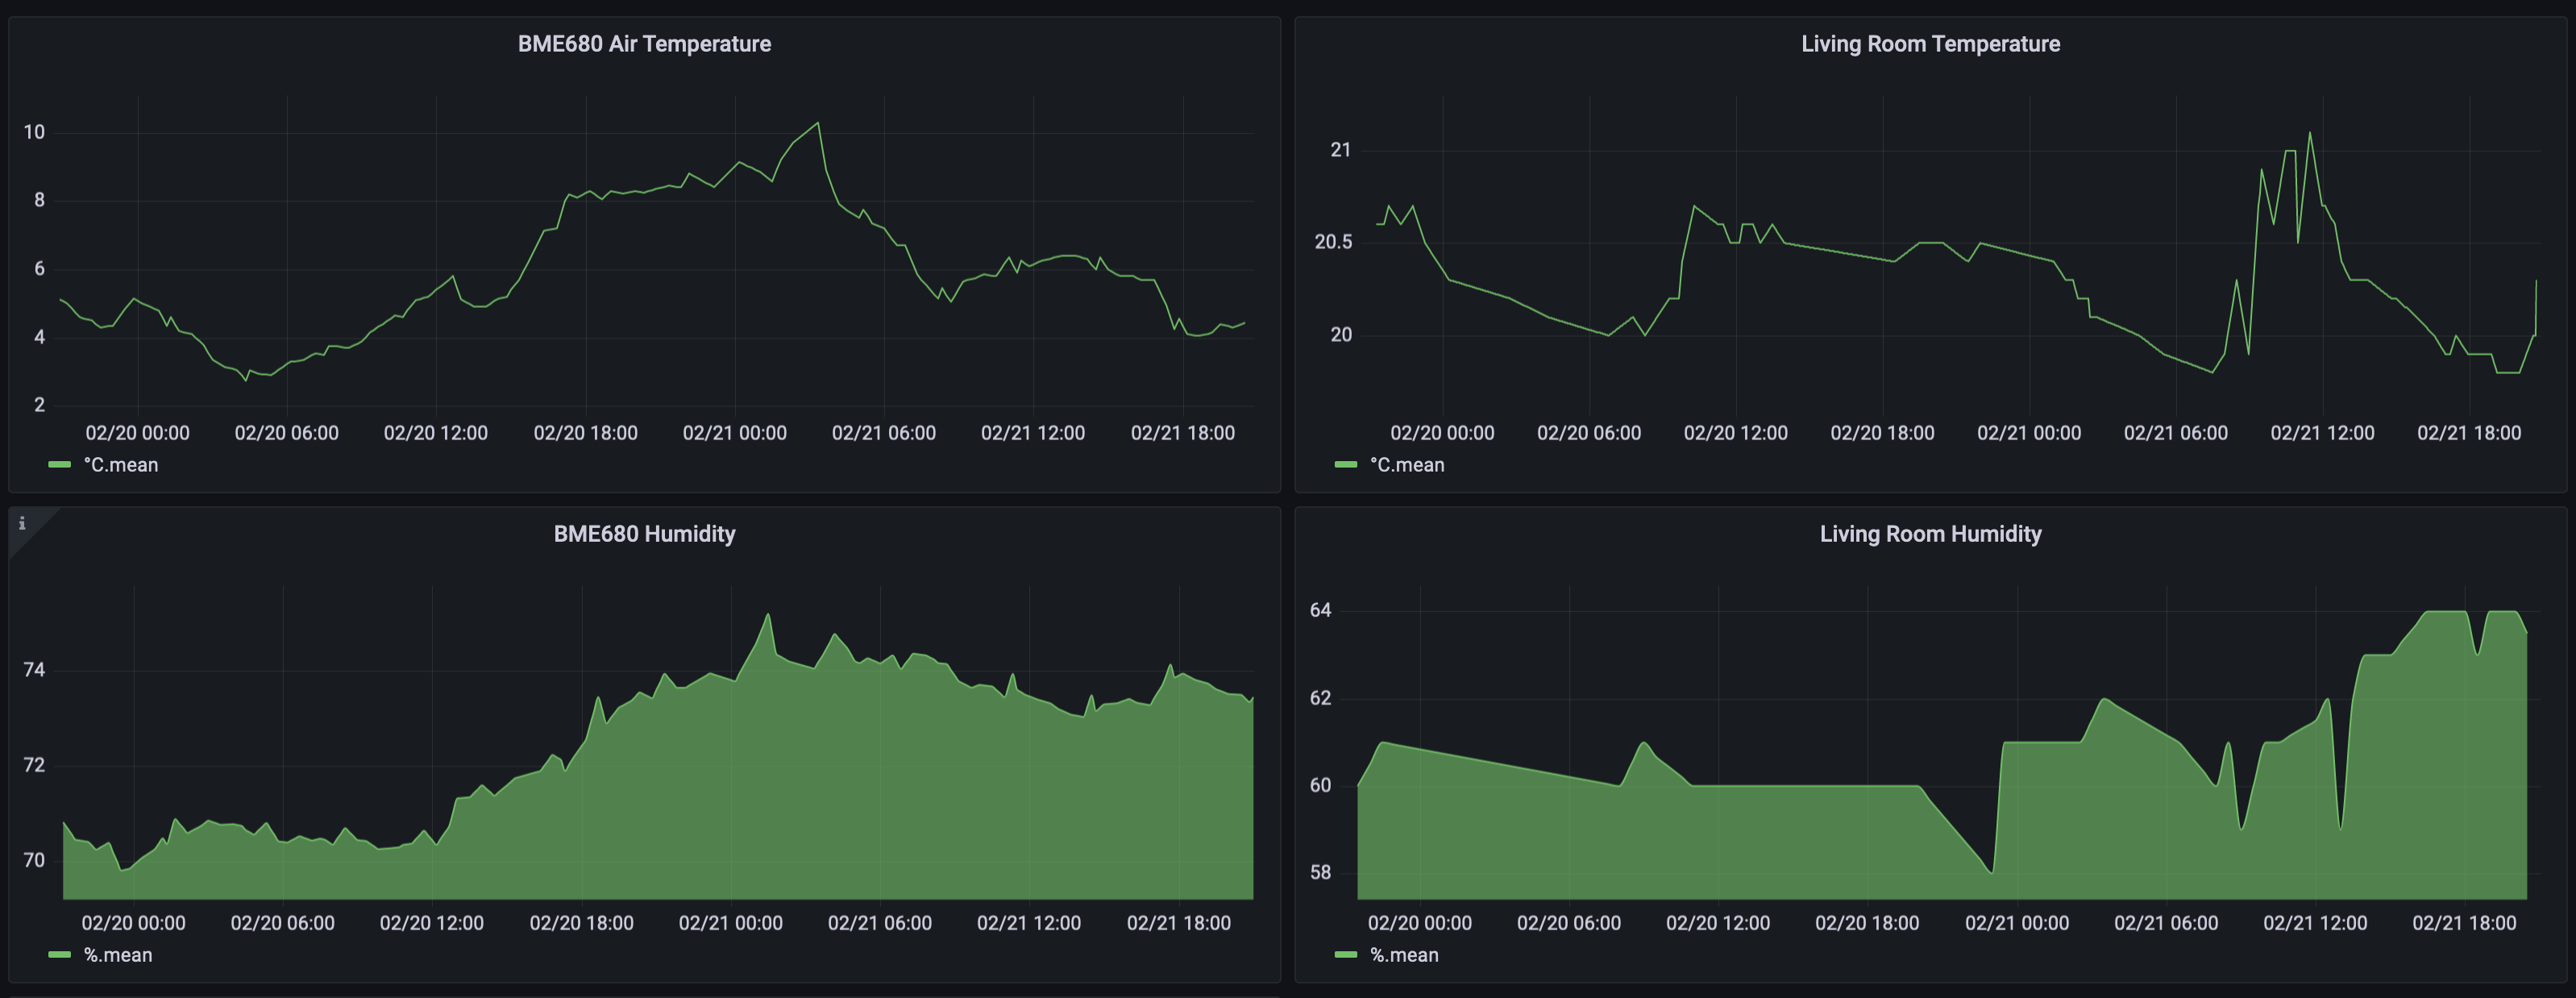
And with similar queries, I could get all the temperature and humidity data collected into these graphs:

I’m quite happy with this result.
Conclusion
Home Assistant collects all state changes and sensor data for all configured devices. But you can get an additional copy of this data, in the form of entries into a timeseries database, by configuring the access to an InfluxDB instance. This database is purely additional, Home Assistant will store all data inside its own database and in the configured InfluxDB. And here you can start to read and visualize this data.
To get you started, this article also investigated how Home Assistant stores the date: sensor data is collected in tables with names representing the measurement value, like V, dBm, or °C, and state changes are collected in the state measurement. You saw the table columns and their meaning. Finally, I also showed how to create Grafana dashboards from these measurements, facing the challenges of duplicate date when Home Assistant stores similar measurements for multiple configured entities.
Footnotes
[^1]: If you want visualize the InfluxDB data directly in Home Assistant, read this step-by-step guide.
