Nomad provides essential hardware metrics about your nodes: Disk I/O, RAM, CPU. Learn how to collect these metrics with Prometheus, and visualize them using Grafana.
After a long journey we finally have all the moving pieces together to implement hardware monitoring. Let’s repeat: On each node, we have installed the service discovery software Consul, the job scheduler Nomad and Docker. Nomad spins up Docker container that run somewhere in the cluster. Consul gets notified about running containers and registers the services.
The source for metrics will be Nomad. Why? In the initial article, I wanted to use Consul for this task. But Nomad provides out of the box hardware metrics (CPU, RAM, Disk) of each node, and it also provides metrics about allocations. This means we can monitor any other docker container and therefore any application that runs in the cluster!
The final solution will be achieved by performing these steps:
- Configure Nomad Agents to supply Prometheus-compatible data
- Configure Prometheus to access Nomad metrics endpoints
- Configure Grafana to visualize Prometheus data
Configure Nomad
Nomad shall provide Prometheus-compatible metrics about the nodes and the allocations, updated every second. All of this is expressed in this telemetry stanza that needs to be added to the file nomad.conf.hcl.
telemetry {
  collection_interval = "1s",
  prometheus_metrics = true,
  publish_allocation_metrics = true,
  publish_node_metrics = true
}
Restart the agent, and now you can access the metrics.
curl http://192.168.2.201:4646/v1/metrics?format=prometheus

# HELP nomad_client_unallocated_cpu nomad_client_unallocated_cpu
# TYPE nomad_client_unallocated_cpu gauge
nomad_client_unallocated_cpu{datacenter="infrastructure_at_home",node_class="none",node_id="c2a79d23-9851-fd9b-dece-f86908d58d3c"} 5600
# HELP nomad_client_unallocated_disk nomad_client_unallocated_disk
# TYPE nomad_client_unallocated_disk gauge
nomad_client_unallocated_disk{datacenter="infrastructure_at_home",node_class="none",node_id="c2a79d23-9851-fd9b-dece-f86908d58d3c"} 26598
# HELP nomad_client_unallocated_memory nomad_client_unallocated_memory
# TYPE nomad_client_unallocated_memory gauge
nomad_client_unallocated_memory{datacenter="infrastructure_at_home",node_class="none",node_id="c2a79d23-9851-fd9b-dece-f86908d58d3c"} 926
Configure Prometheus
Nomad provides the metrics at the endpoint $IP:4646/v1/metrics. Instead of configuring fixed IP addresses, we will use Consul to resolve node names. The configuration is this:
- job_name: nomad
  metrics_path: "/v1/metrics"
  params:
    format: ['prometheus']
  scheme: http
  static_configs:
  - targets:
    - raspi-3-1.node.consul:4646
    - raspi-3-2.node.consul:4646
    - raspi-4-1.node.consul:4646
    - raspi-4-2.node.consul:4646
Running Prometheus and Grafana as Docker Containers
To start Docker containers with Nomad, you define a purely declarative job specification and apply it. The job defines what to run, how much instances you want, what ports to open, if you want to provide a health-check of the service, and much more. See the previous article about Application Management with Nomad.
For Prometheus, the relevant declaration identifies the image, mounts the config file, sets a Docker volume, and maps the UI port.
task "prometheus" {
  driver = "docker"
  config {
    image = "prom/prometheus:latest"
    volumes = [
      "local/prometheus.yml:/etc/prometheus/prometheus.yml",
    ]
    mounts = [
      {
        type = "volume"
        target = "/prometehus"
        source = "prometheus"
      }
    ]
    port_map {
      prometheus_ui = 9090
    }
  }
  ...
}
For Grafana, we also define the image, set a Docker volume, and map the port.
task "graphana" {
  driver = "docker"
  config {
    image = "grafana/grafana:6.6.2"
    mounts = [
      {
        type = "volume"
        target = "/var/lib/grafana"
        source = "graphana"
      }
    ]
    port_map {
      http = 3000
    }
  }
  ...
}
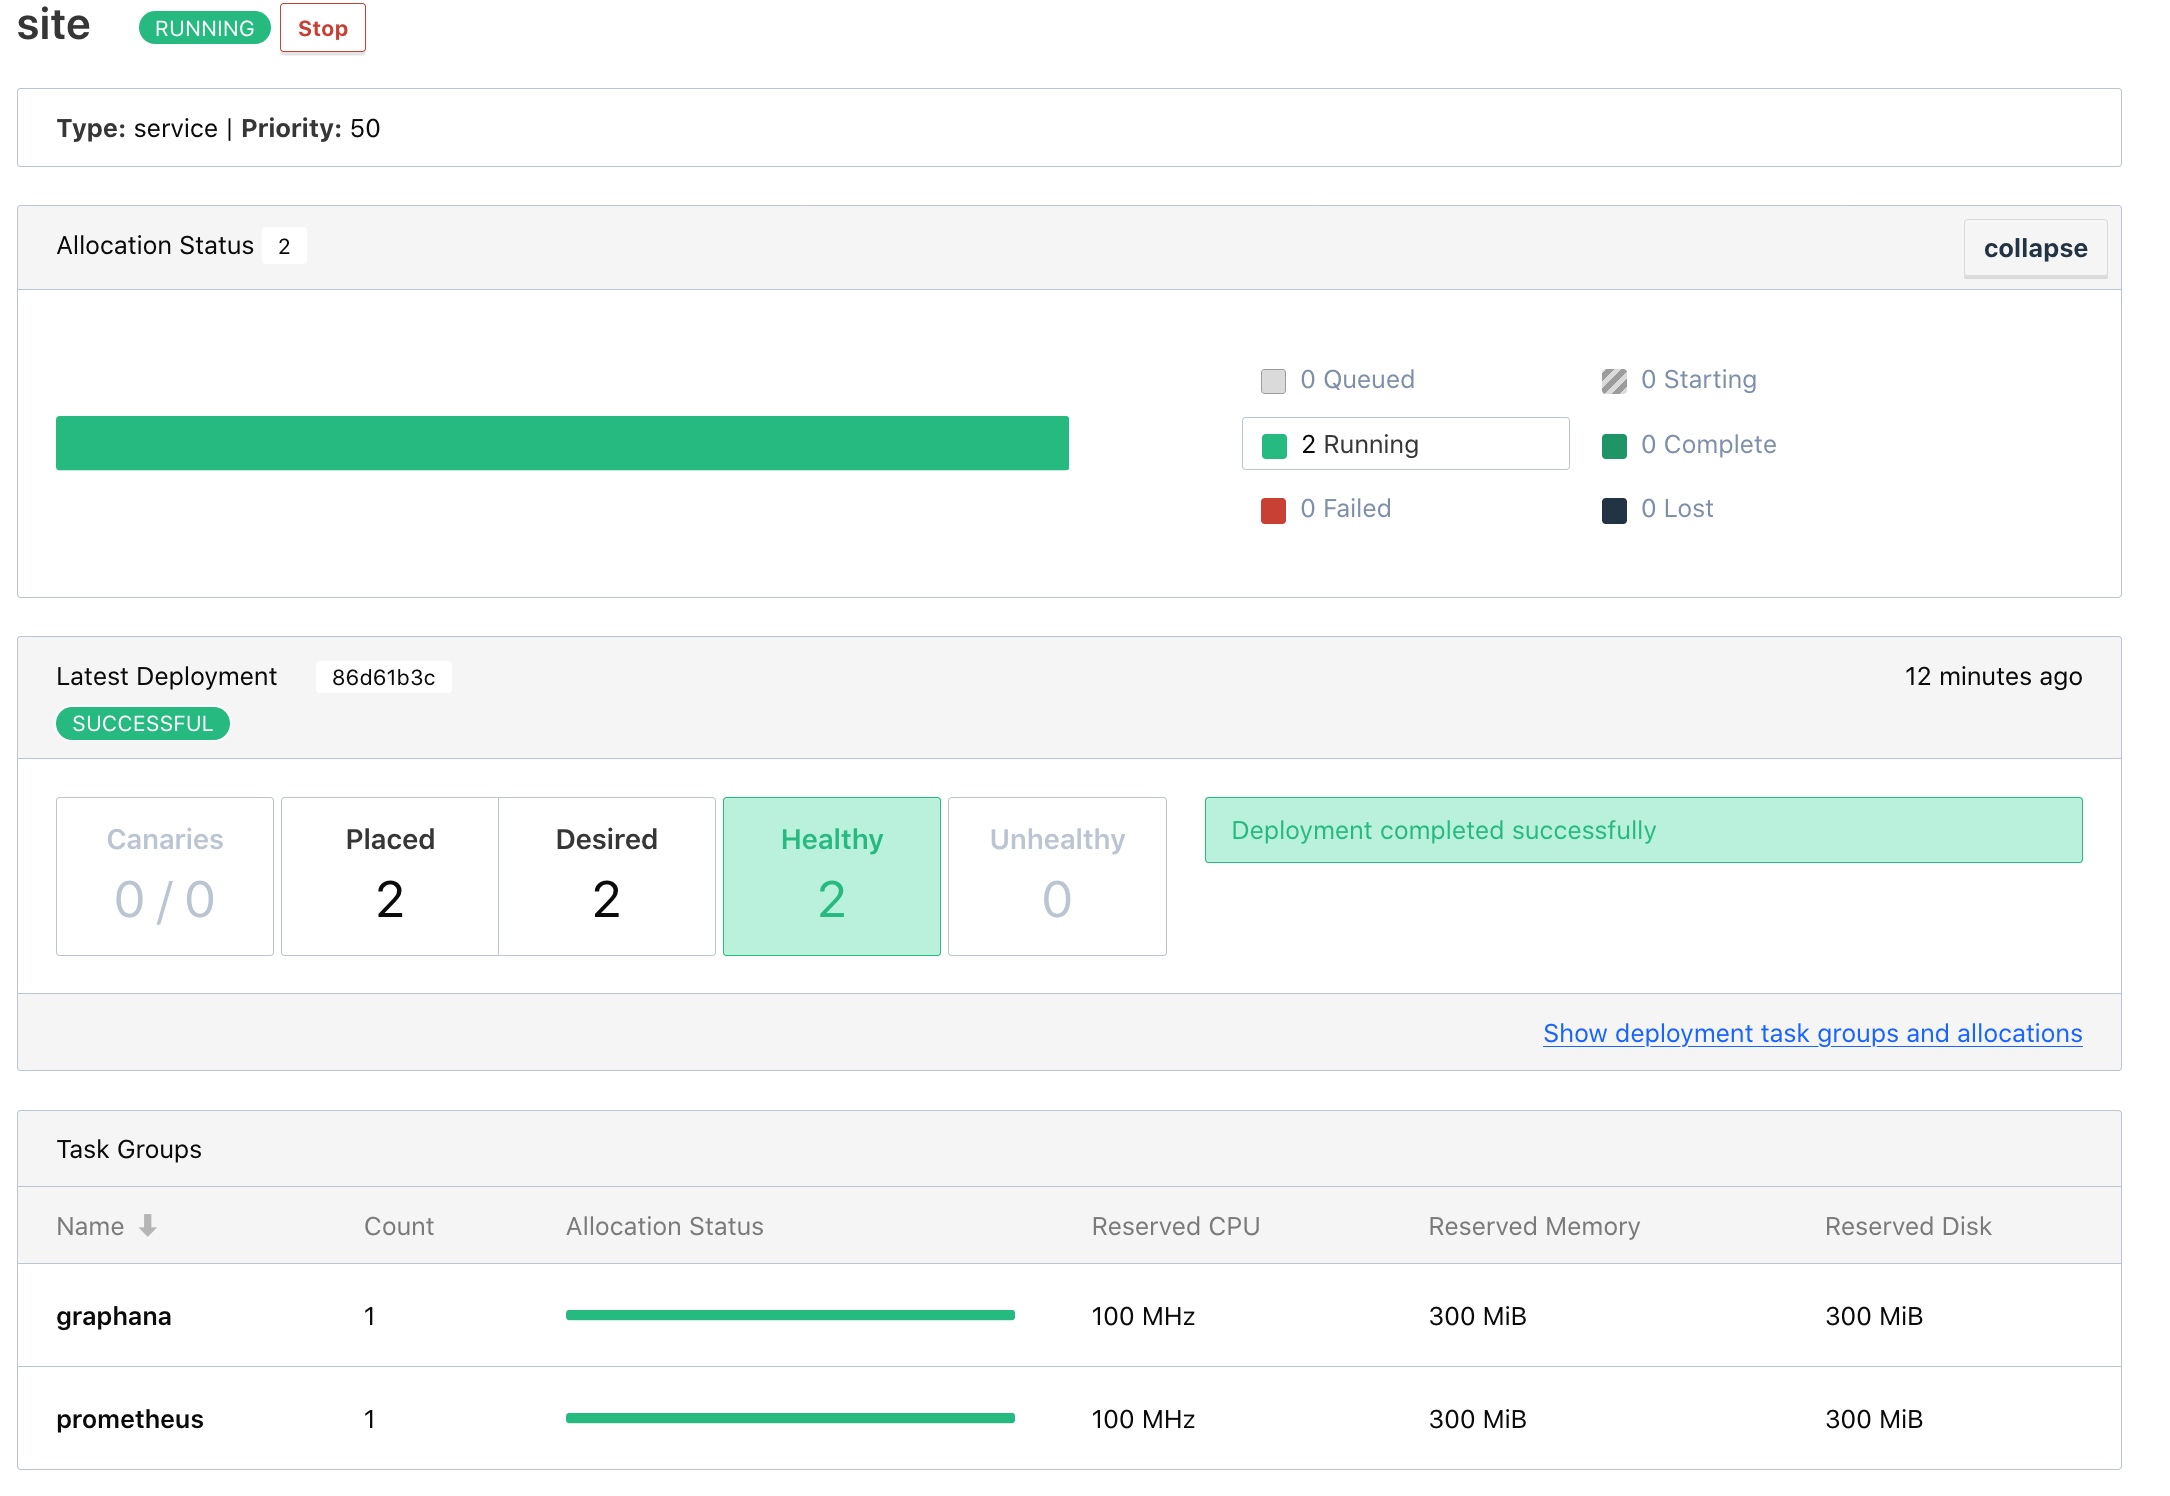
Executing
Let’s execute the monitoring job.
>>nomad job run -address=http://192.168.2.204:4646 jobs/prometheus_docker.job.nomad

==> Monitoring evaluation "ad5a5599"
    Evaluation triggered by job "prometheus"
    Evaluation within deployment: "158c6e72"
    Allocation "1bf7bfd2" created: node "7be9e3ea", group "monitoring"
    Evaluation status changed: "pending" -> "complete"
==> Evaluation "ad5a5599" finished with status "complete"
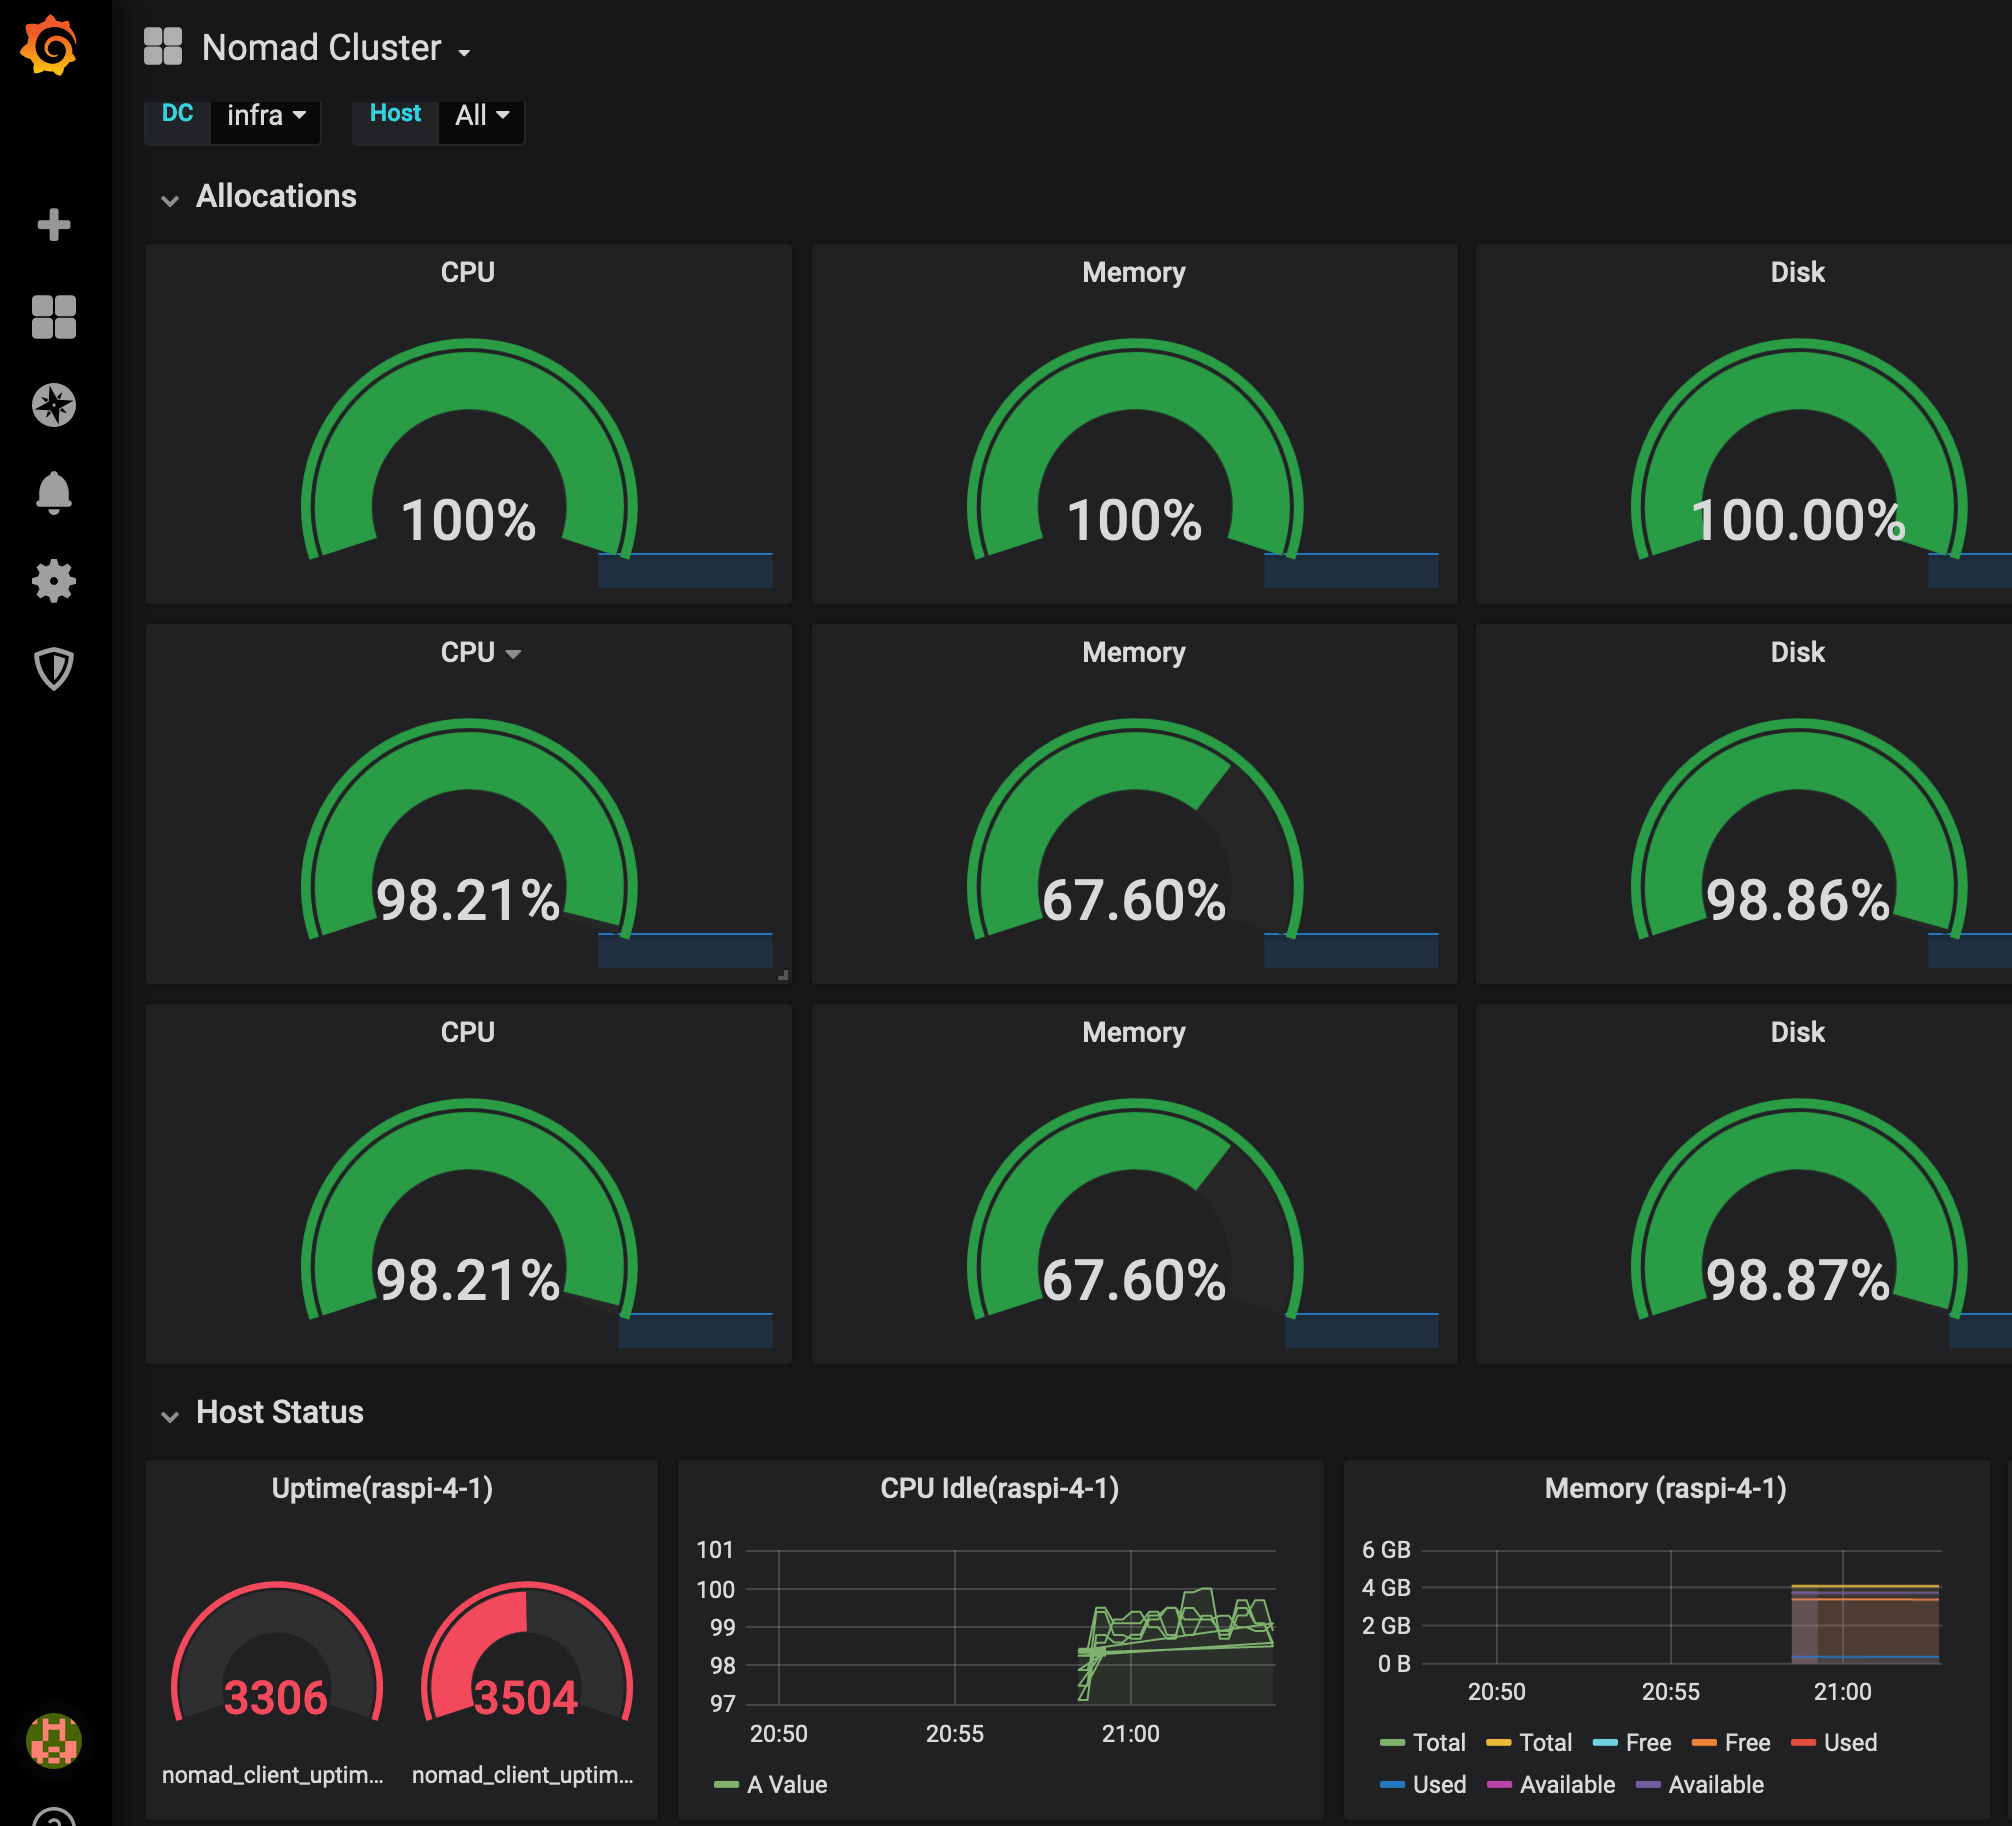
Head over to the dashboard, and see that Grafana is running.
Finally I open Grafana via IP and port, apply and configure a recommended Nomad Dashboard, and can see the health of all nodes.

Conclusion
This article showed how to gather and visualize Hardware metrics using Nomad, Prometheus and Grafana. Nomad exposes Prometheus-friendly metrics with few lines of configuration. Prometheus can pick up this rich data and store it. Finally, Grafana accesses the data, and be choosing and tweaking one of the many dashboards we achieve a great visualization. Prometheus and Grafana run as Docker containers, started and governed by Nomad itself. There are still two challenges left: Using proper domain names to access the containers, for example grafana.infra.consul, and to persist the data when the container is deployed to another physical node.