Collecting metrics is important. Learn how to monitor the cpu and ram of nodes with Consul using the Prometheus database and visualization with Grafana.
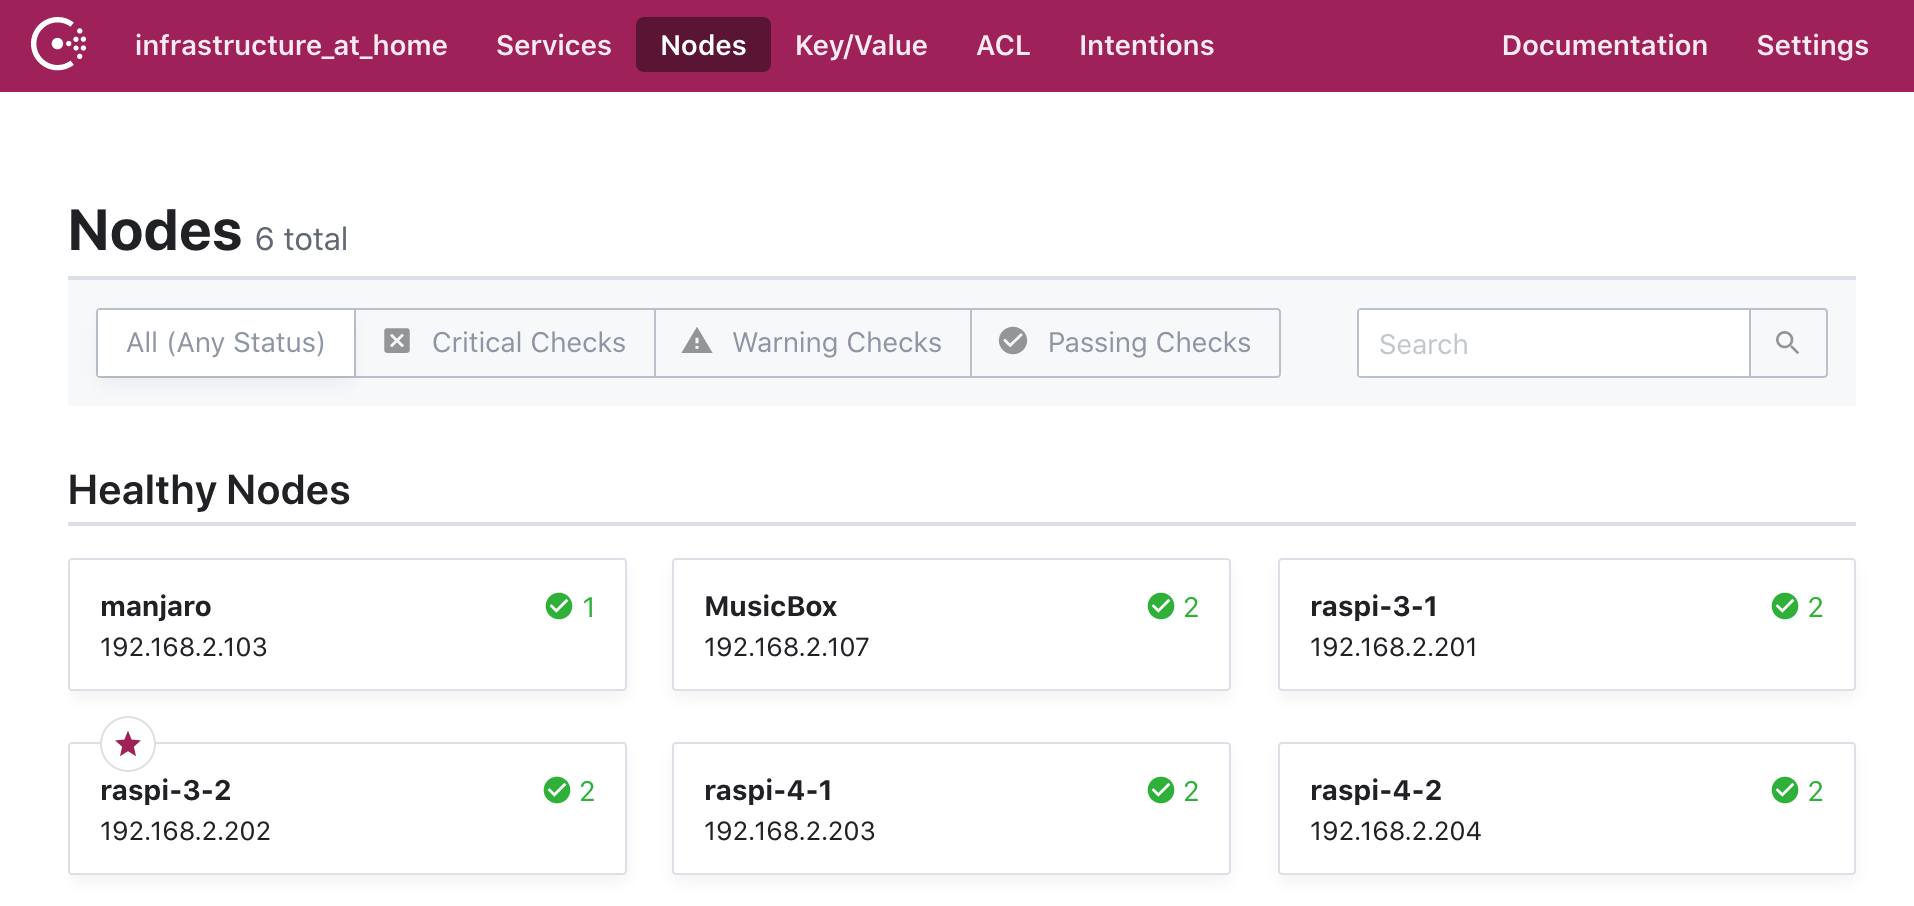
In the last article, I showed how to install the service monitoring and discovery solution Consul. With this solution, we can connect all nodes in a cluster and see their health status. However, one requirement is still missing: Monitoring the CPU and RAM of the nodes. Exploring how to fulfill this requirement lead me to some interesting ideas and findings. Exploring also meant to go in circles - that is, to come back where I was, but with better understanding and tools. Normally, I try to keep my articles short - this one is the exception, because I just found the journey so interesting that I need to share it with you.
How to Collect Hardware Metrics
When I first read the metrics that Consul provides, I saw that they are about measuring the cluster health, things like number of leadership changes or performance metrics about the key-value store. These metrics are, at the moment, uninteresting for us. Consul metrics can be obtained via the command line or via an HTTP endpoint. Calling these only provides a snapshot of the current health. There is no dashboard, no data retention that comes bundled with Consul. However, you can define a telemetry configuration: A service to which Consul will push metrics data.
Which services are supported? Here, the Consul documentation becomes a bit blurry:
- Circonus, DataDog, Statsd in the operations tutorial about metrics)
- Prometheus in the telemetry configuration paramaters
- Telegraf in the operations tutorial about telegraf
These are a lot of options! What do I need? To be honest, I had not enough information about them, no conceptual framework to differentiate them.
After some reading, I came up with the following concepts to understand what monitoring really is about. An agent is a process that runs on a node to collect metrics. This data is stored inside a timeseries database. The database can pull data from the agent, or the agent pushes data to the database. The data can be visualized with a dashboard.
The most often mentioned tools for these different monitoring aspects are:
- Dashboard
- Timeseries database
- Agents
- Telegraf for Influxdb
- Node exporter for Prometheus
- Statsd Universal
So, I concluded to either have a stack of Node exporter, Prometheus and Grafana, or Telegraf, Influxdb and Chronograf. Still, this is a lot of software to install and manage for metrics collection and visualization.
Let’s stop here for a moment.
Reviewing my Infrastructure@Home Requirements
It is good to have requirements for projects. What are the next open requirements in my project? Application management. I want to be able to dynamically deploy applications as OS-specific packages, binaries or docker container to specific nodes or somewhere in the cluster. And I want to have dynamic service discovery. Can I work towards these requirements and fulfill the monitoring aspects as well?
Some of the monitoring tools can be run inside a Docker container. So once I can deploy docker containers in my cluster, I can put monitoring software as docker containers to the cluster. This idea sounds exiting! Docker everywhere! I can run agents on each node, and somewhere in the cluster a database and the dashboard which are reachable via DNS names.
Let’s continue in this direction!
Installing Docker
The first step is to get Docker running on all my nodes. As before, I created an Ansible playbook. Installation on Arch-Linux can be done via the package manager. For Raspberry Pi, I followed this excellent documentation, which boils down to these specific steps:
- Install docker dependencies
- Download and execute docker install shell script
- Add raspian docker repo
- Update the complete system
- Enable Docker with systemd
I will not detail this books development because it follows the same steps as my Consul playbook from the last time.
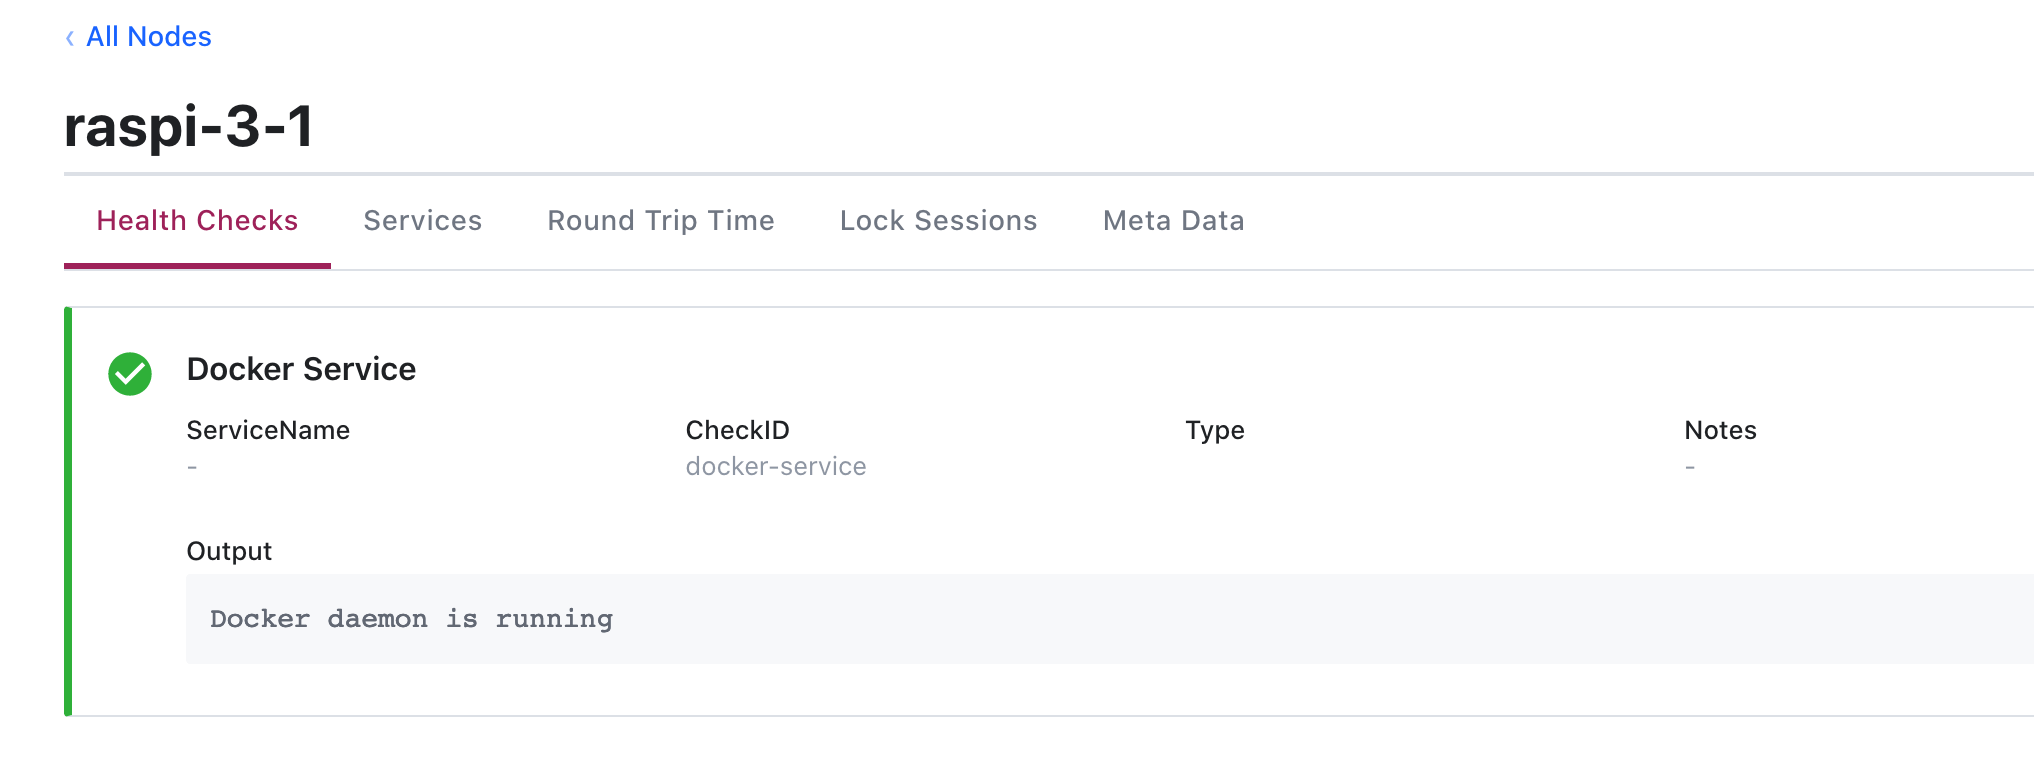
Additionally, I created a Docker service health check in Consul. A health check is defined as a YAML file. You define the name of the service, a command to run, and the interval. I came up with this file:
{
  "check": {
    "id": "docker-service",
    "name": "Docker Service",
    "args": [
      "/usr/local/bin/docker_health_check.sh"
    ],
    "interval": "10s",
    "status": "passing"
  }
}
The health check itself is a simple bash script:
#! /bin/bash
systemctl status docker > /dev/null 2>&1

if [[ $? -eq 0 ]]; then
    echo "Docker daemon is running."
    exit 0
else
    echo "Error! Docker daemon is not running."
    exit 1
fi
Now, Docker is successfully installed and monitored in Consul.
How to manage Docker Containers
Now we finally have the capabilities to start Docker containers. And again, the question of how arises:
- Use plain
dockerto create and run images on hosts - Use
docker-composeto orchestrate running a set of dependent containers on hosts - Use ansible docker_image to create images and docker_container to run containers on nodes
- Use ansible_container to build, publish and orchestrate running a set of dependent containers in environments like OpenStack or K8S
- Use Hashicorp Nomad to orchestrate containers and run them on a cluster
Since starting the series, Nomad has been my “solution in mind” to deploy any application on the cluster. Since it can run Docker, and since metrics agents, database and dashboards can run in Docker too, Nomad will be the vehicle to bootstrap the metrics collection. However, I do not have the experience with Nomad, and therefore I will write Ansible scripts that will deploy the docker containers with the monitoring software for me.
Prometheus in Docker
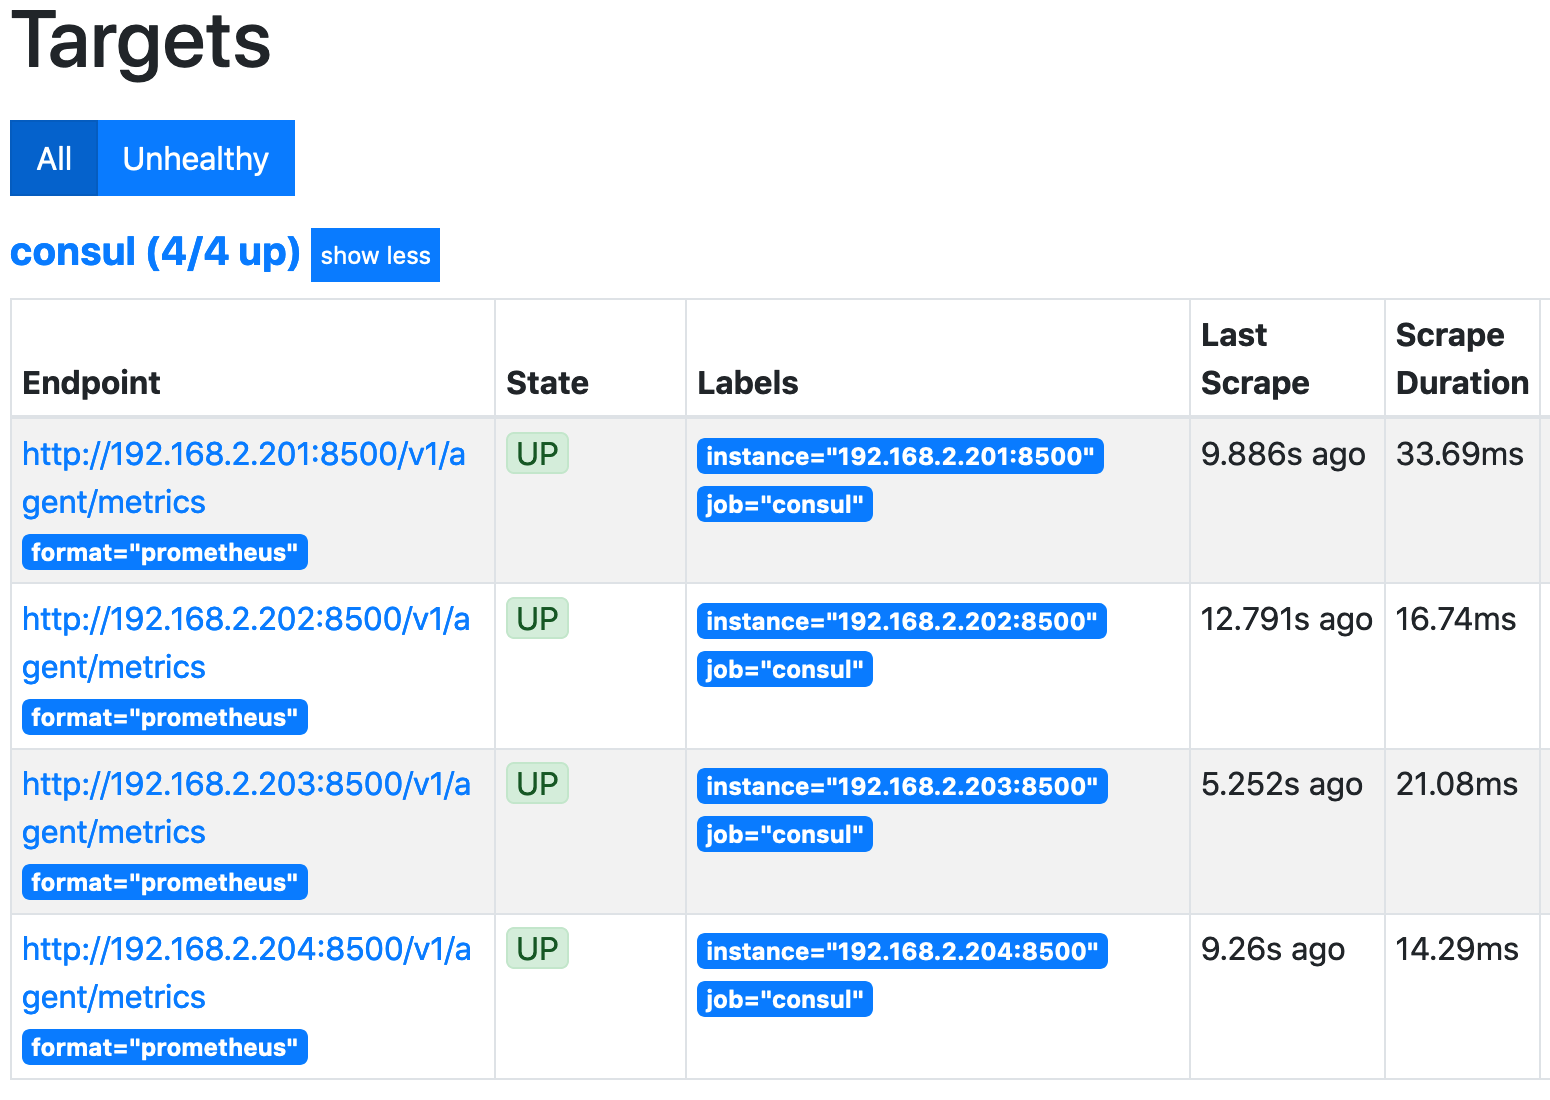
Prometheus will be configured to fetch metrics from consul. This is the relevant configuration part:
- job_name: consul
  metrics_path: "/v1/agent/metrics"
  params:
    format: ['prometheus']
  scheme: http
  static_configs:
  - targets:
    - 192.168.2.201:8500
    - 192.168.2.202:8500
    - 192.168.2.203:8500
    - 192.168.2.204:8500
Then execute the docker container.
docker run -d --network host \
  -v /home/pi/prometheus.yml:/etc/prometheus/prometheus.yml \
  prom/prometheus:v2.16.0
And we can see the Prometheus UI:
Grafana in Docker
The final step is to start Grafana, configure it to use the Prometheus data source, and then choose a suitable Dashboard.
Grafana will be started with this docker command:
docker run -d --network host grafana/grafana:6.6.2
Then, we access the Web UI, add the Grafana data source and a suitable Consul dashboard, like this one.
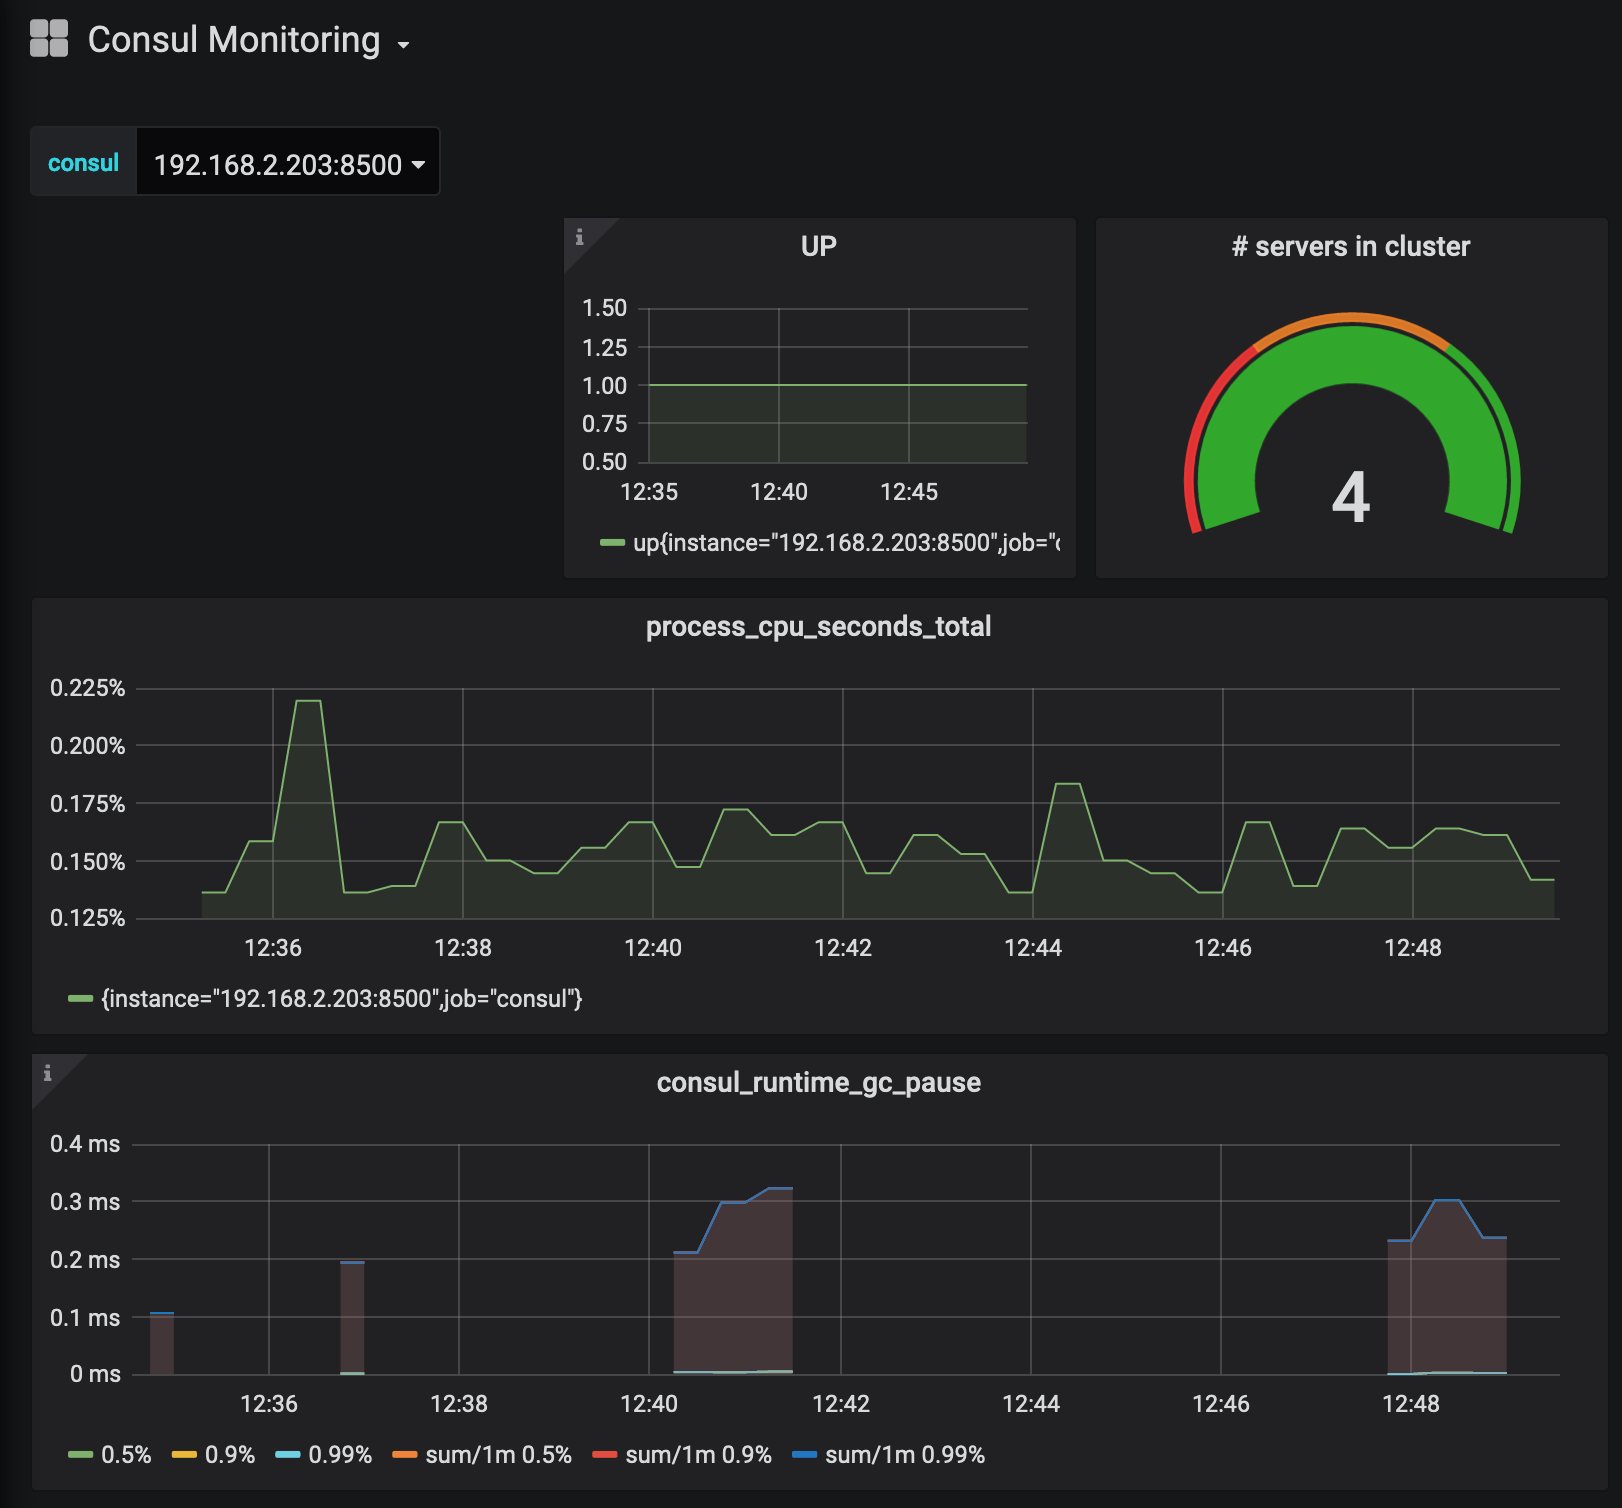
Conclusion
This was a long article, as long as the journey. We arrived at a state where metrics are collected, captured by Prometheus and rendered with Grafana. However, we use explicit docker run commands to start this. I want to improve on that: The containers should be started with a service management software, and their configuration should be dynamic with hostnames instead of fixed IP addresses. This will be done in a future article.