Wikipedia is a rich source of information and knowledge. Conveniently structured into articles with categories and links to other articles, it also forms a network of related documents. My NLP project downloads, processes, and applies machine learning algorithms on Wikipedia articles.
In my last article, the projects outline was shown, and its foundation established. First, a Wikipedia crawler object that searches articles by their name, extracts title, categories, content, and related pages, and stores the article as plaintext files. Second, a corpus object that processes the complete set of articles, allows convenient access to individual files, and provides global data like the number of individual tokens.
In this article, a curated set of Wikipedia articles is created and KMeans clustering applied. Specifically, you will learn how to prepare the corpus data as a DataFrame.
The technical context of this article is Python v3.11 and scikit-learn v1.2.2. All examples should work with newer library versions too.
Context
This article is part of a blog series about NLP with Python. In my previous articles, I covered how to create the WikipediaReader article crawler, which will take an article name as the input, and then systematically downloads all linked articles until the given total number of articles or depth is achieved. The crawler produces text files, which are then further processed by an WikipediaCorpus object, a self-created abstraction on top of NLTK, that gives convenient access to individual corpus files and corpus statistics like number of sentences, paragraphs and the vocabulary.
In this article, the WikipediaReader will download 100 subpages from the articles “Machine Learning”, “Spacecraft”, and “Python (programming language)”, creating a corpus of 270 articles. Then, a SciKit Learn pipeline is applied that processes each document for preprocessing, tokenization, and bag-of-words encoding. This data is finally vectorized and fed into KMeans clustering.
Setup and Data Exploration
The foundation for the WikipediaReader, WikipediaCorpus and the pipeline are explained in an earlier article, along with all required libraries.
The starting point for this article is to download 100 article documents for the three mentioned topics.
reader = WikipediaReader(dir = "articles")

reader.crawl_pages("Artificial Intelligence", total_number = 100)
reader.process()
reader.reset()

reader.crawl_pages("Spacecraft", total_number = 100)
reader.process()
reader.reset()

reader.crawl_pages("Python (programming language)", total_number = 100)
reader.process()
reader.reset()
The corpus object yields the following statistics. Because some articles are mentioned several times, the resulting number of documents is only 270.
root_path = './articles'
corpus = WikipediaPlaintextCorpus(root_path)
print(corpus.describe())
# {'files': 270, 'paras': 13974, 'sents': 47289, 'words': 1146248, 'vocab': 40785, 'max_words': 21058, 'time': 6.870430946350098}
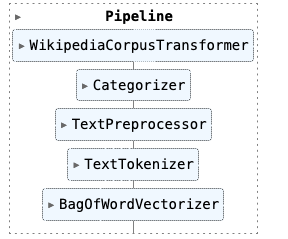
On this corpus, the following SciKit Learn pipeline definition is applied:
root_path = './articles'

pipeline = Pipeline([
    ('corpus', WikipediaCorpusTransformer(root_path=root_path)),
    ('categorizer', Categorizer(WikipediaReader())),
    ('preprocessor', TextPreprocessor(root_path=root_path)),
    ('tokenizer', TextTokenizer()),
    ('vectorizer', BagOfWordVectorizer(WikipediaPlaintextCorpus(root_path))),
])
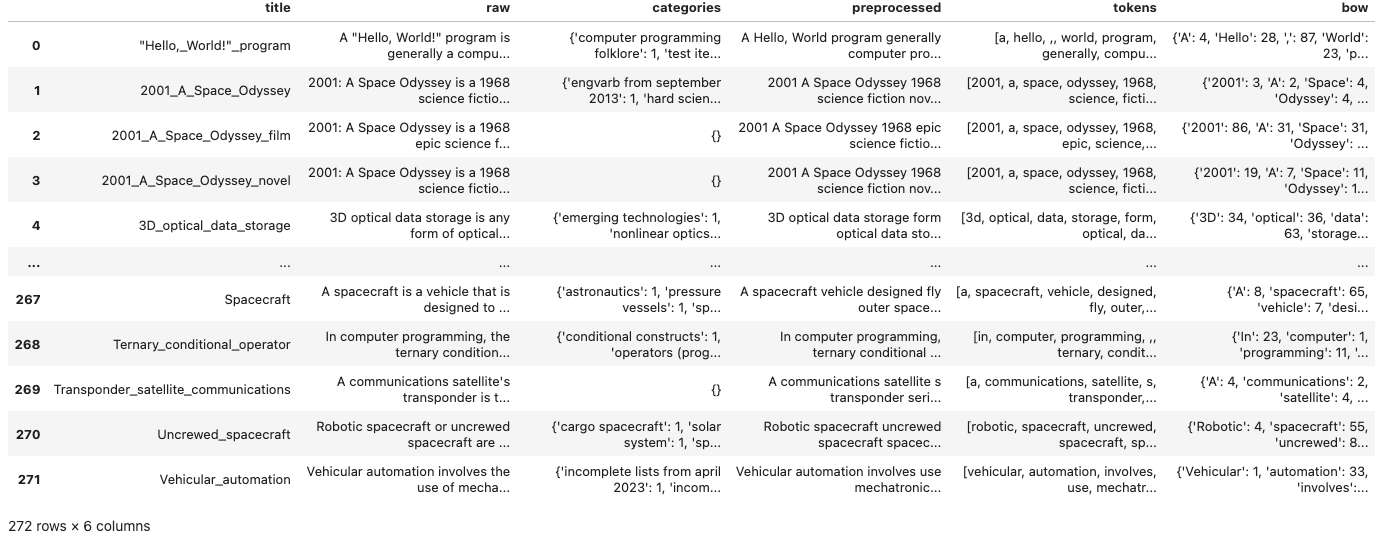
And the resulting DataFrame contains these columns:
- title: The Wikipedia article title (conserving capitalization, but replacing spaces with underscores)
- raw: The raw, unformatted text
- categories: A dictionary of category names that are defined on Wikipedia for this page
- preprocessed: Lemmatized and stop word removed text
- tokens: The tokenized preprocessed text
- bow: A bag-of-word counter off the preprocessed text.
Clustering with SciKit Learn
Clustering is the process of separating multi-dimensional data points into coherent sets with same properties. Several concrete algorithms exist that differ in their method, their capabilities and approach to detect clusters, and their processing of input values and generating of output values. Looking at SciKit Learn clustering algorithm documentation page, following algorithms are supported:
- AffinityPropagation
- AgglomerativeClustering
- Birch
- DBSCAN
- FeatureAgglomeration
- KMeans
- BisectingKMeans
- MiniBatchKMeans
- MeanShift
- OPTICS
- SpectralClustering
- SpectralBiclustering
- SpectralCoclustering
An in-depth explanation of these algorithms is outside of this article scope. If you are curious, please refer to the documentation page and other sources like Wikipedia articles.
To start using clustering algorithms with SciKit learn, its best to understand and learn from an example. Specifically, the following points should become clear:
- How to define and configure a particular clustering algorithm?
- What is the expected shape of the input data?
- How to start cluster generation (number of iterations, keep best fitting model)?
- What is the output of the algorithm (binary vs. multi-class association, features detected in the input data)?
- Which metrics can be used to compute how good a cluster separation is?
The example of choice is a KMeans example tutorial that shows how to cluster a build-in dataset.
KMeans Clustering Example
The KMeans algorithm detects clusters by forming voroni cells with centroid points such that the mean distance between data points and centroids is minimal.
The SciKit Learn example works on a built-in dataset of newsgroup articles. The articles are loaded as follows:
# Source: https://scikit-learn.org/stable/auto_examples/text/plot_document_clustering.html#sphx-glr-auto-examples-text-plot-document-clustering-py
import numpy as np
from sklearn.datasets import fetch_20newsgroups

categories = [
    "alt.atheism",
    "talk.religion.misc",
    "comp.graphics",
    "sci.space",
]

dataset = fetch_20newsgroups(
    remove=("headers", "footers", "quotes"),
    subset="all",
    categories=categories,
    shuffle=True,
    random_state=42,
)
The resulting object dataset provides the following methods to access the corpora and its categories:
print(dataset.DESCR)
# _20newsgroups_dataset:
#
#  The 20 newsgroups text dataset
#  ------------------------------
#
#  The 20 newsgroups dataset comprises around 18000 newsgroups posts on
#  20 topics split in two subsets: one for tr ...

print(dataset.data[:1])
# ["My point is that you set up your views as the only way to believe.  Saying \nthat all eveil in this world is caused by atheism is ridiculous and \ncounterproductive to dialogue in this newsgroups.  I see in your posts a \nspirit of condemnation of the atheists in this newsgroup bacause they don'\nt believe exactly as you do.  If you're here to try to convert the atheists \nhere, you're failing miserably.  Who wants to be in position of constantly \ndefending themselves agaist insulting attacks, like you seem to like to do?!\nI'm sorry you're so blind that you didn't get the messgae in the quote, \neveryone else has seemed to."]

print(dataset.filenames)
#['/Users/guenthers/scikit_learn_data/20news_home/20news-bydate-train/alt.atheism/53184'
# '/Users/guenthers/scikit_learn_data/20news_home/20news-bydate-train/comp.graphics/37932'
# '/Users/guenthers/scikit_learn_data/20news_home/20news-bydate-test/comp.graphics/38933' ...

print(dataset.target)
# [0 1 1 ... 2 1 1]

print(dataset.target_names)
# ['alt.atheism', 'comp.graphics', 'sci.space', 'talk.religion.misc']
As can be seen, the dataset is simply a raw text representation, and the category names are strings stored inside a list. The association between an article and a category is expressed as single number that represents the category in its list. For example, the first article in the above example lists 0 as its category, which means dataset.target_names[0] that leads to alt.atheism.
This data is vectorized with a built-in vectorizer. The example uses TfIdf.
# https://scikit-learn.org/stable/auto_examples/text/plot_document_clustering.html#sphx-glr-auto-examples-text-plot-document-clustering-py
from sklearn.feature_extraction.text import TfidfVectorizer

vectorizer = TfidfVectorizer(
    max_df=0.5,
    min_df=5,
    stop_words="english",
)
t0 = time()
X_tfidf = vectorizer.fit_transform(dataset.data)
The clustering algorithm is defined with the following snippet:
# https://scikit-learn.org/stable/auto_examples/text/plot_document_clustering.html#sphx-glr-auto-examples-text-plot-document-clustering-py
kmeans = KMeans(
    n_clusters=true_k,
    max_iter=100,
    n_init=5,
)
And to compute a particular clustering model, its metrics (homogeneity, completeness, v-measure) and its training time, the following method is used:
# Source: https://scikit-learn.org/stable/auto_examples/text/plot_document_clustering.html#sphx-glr-auto-examples-text-plot-document-clustering-py
def fit_and_evaluate(km, X, name=None, n_runs=5):
    name = km.__class__.__name__ if name is None else name

    train_times = []
    scores = defaultdict(list)
    for seed in range(n_runs):
        km.set_params(random_state=seed)
        t0 = time()
        km.fit(X)
        train_times.append(time() - t0)
        scores["Homogeneity"].append(metrics.homogeneity_score(labels, km.labels_))
        scores["Completeness"].append(metrics.completeness_score(labels, km.labels_))
        scores["V-measure"].append(metrics.v_measure_score(labels, km.labels_))
        scores["Adjusted Rand-Index"].append(
            metrics.adjusted_rand_score(labels, km.labels_)
        )
        scores["Silhouette Coefficient"].append(
            metrics.silhouette_score(X, km.labels_, sample_size=2000)
        )
    train_times = np.asarray(train_times)

fit_and_evaluate(kmeans, X_tfidf, name="KMeans\non tf-idf vectors")
This is a lot of code, lets separate out observations a bit. This method repeatedly starts a KMeans cluster with a different random seed value. It sets the starting time for the training, calls the .fit(X) method to create the cluster, and then computes different metric scores. Each score compares the set of expected labels to the labels generated by the clustering algorithm. Finally, the training time and the metrics are returned as a dictionary to the caller.
Now all raised questions can be answered.
- How to define and configure a particular clustering algorithm? => The algorithm is represented as a Python class with a set of pre-defined and customizable parameters specific to the algorithm.
- What is the expected shape of the input data? => A matrix of the shape
number_of_samples x data_vector, where thedata_vectoris numerical data and needs to have the same length for all samples. - How to start cluster generation (number of iterations, keep best fitting model)? => The cluster generation is started by calling
.fit()on the Python object and supplying the input data. This method returns an object that represents a concrete clustering schema. - What is the output of the algorithm (binary vs. multi-class association, features detected in the input data)? => The clustering scheme consists of a list associating a sample with an index number. The index number represents a cluster.
- Which metrics can be used to compute how good a cluster separation is? Metrics are cluster algorithm specific, and they need a set of expected clusters to be computed.
With this knowledge, lets attempt a naive attempt of using KMeans.
Naive KMeans
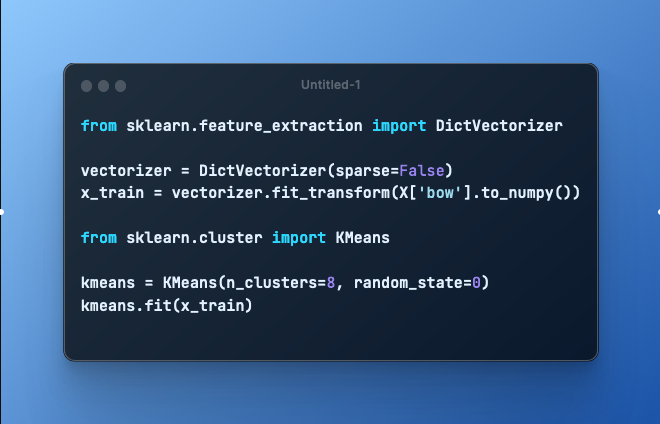
First of all, the Wikipedia articles need be converted to a vector representation. For this, we will use the created bag-of-words, which is a dictionary data structure in which the index is a word and the value the number of occurrences for this word. This dictionary will be converted with the built-in DictVectorizer.
from sklearn.feature_extraction import DictVectorizer

vectorizer = DictVectorizer(sparse=False)
x_train = vectorizer.fit_transform(X['bow'].to_numpy())
Then, we create the KMains object and define its properties (8 clusters, random state set to 0).
from sklearn.cluster import KMeans

kmeans = KMeans(n_clusters=8, random_state=0)
This object is trained on the input data.
kmeans.fit(x_train)
And then the resulting clusters can be checked.
print(kmeans.labels_.shape)
#(272,)

print(kmeans.labels_)
#[0 0 5 3 6 6 3 0 0 0 0 0 0 3 0 0 0 6 0 3 6 0 5 0 1 6 0 3 6 0 0 0 6 6 0 6 0
# 6 3 0 0 0 3 6 6 0 3 3 0 0 0 3 0 1 5 3 0 0 0 0 6 0 0 5 6 3 5 1 6 5 0 0 0 0
# 0 6 3 0 0 6 0 0 3 3 3 0 6 0 0 0 0 0 6 6 6 6 4 6 5 3 3 6 3 0 1 3 0 0 3 0 6
# 0 0 0 3 5 6 6 4 0 0 0 1 0 6 6 3 6 6 1 0 0 1 6 3 0 6 1 6 6 0 6 0 3 0 6 0 0
# 0 3 1 0 0 6 0 6 6 1 6 6 3 0 0 0 6 0 0 6 0 6 0 6 0 0 0 3 0 0 0 1 0 6 6 6 0
# 1 0 0 3 6 0 1 5 0 0 0 0 3 0 0 5 0 3 6 0 2 6 0 2 0 6 3 3 6 0 0 7 5 0 0 1 3
# 1 6 3 6 0 0 6 1 6 6 0 0 0 0 6 6 0 0 0 6 6 1 5 1 6 1 4 0 0 6 2 3 6 1 3 7 6
# 4 3 3 0 1 3 6 6 6 6 0 6 3]
Cluster Interpretation and Plotting
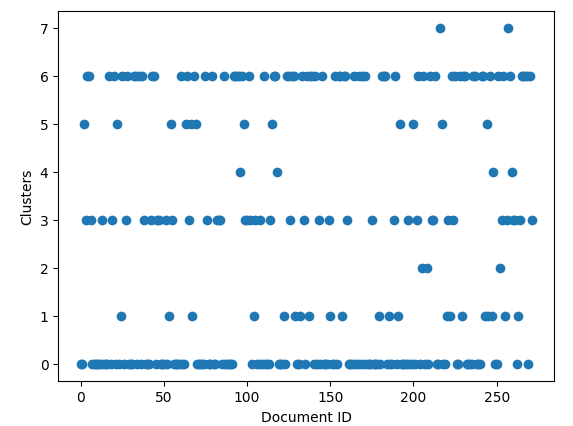
Just be looking at the label vector, it appears that many articles are associated with the very first cluster. Let’s visualize the concrete association.
A bar plot showing the order in which the documents are associated with a cluster:
import matplotlib.pyplot as plt

plt.ylabel('Clusters')
plt.xlabel('Document ID')
plt.plot(kmeans.labels_, 'o')
And a histogram showing absolute counts of documents per cluster:
plt.hist(x=kmeans.labels_,  bins=8, density=False)
plt.grid(True)
plt.show()
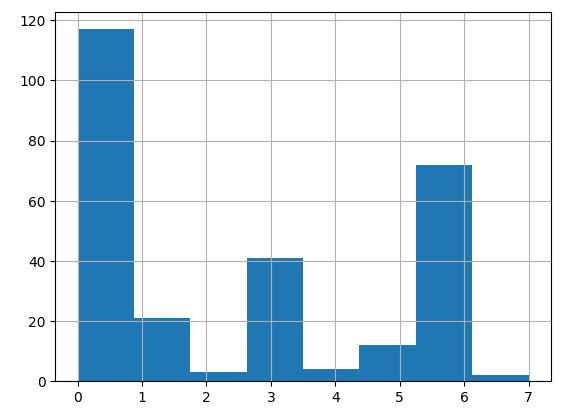
Ok, but what concretely is cluster zero about? Let’s see the articles names first.
def get_cluster_articles(c_id, lables):
    return [X['title'][i] for i,l in enumerate(lables) if l == c_id]

print(get_cluster_articles(0, kmeans.labels_))
# '"Hello,_World!"_program', '2001_A_Space_Odyssey', 'ABC_programming_language', 'ACM_Computing_Classification_System', 'ADMB', 'AIVA', 'AIXI', 'AI_accelerator', 'AI_boom', 'AI_capability_control', 'AI_effect', 'AI_takeover', 'ALGOL_60', 'ANSI_C', 'Abaqus', 'Abstract_and_concrete', 'Academic_Free_License', 'Academic_conference', 'Acoustic_location', 'Activation_function', 'Adam_Tooze', 'Adaptable_robotics', 'Advanced_Simulation_Library', 'Aeronautics', 'Agent_architecture', 'Agricultural_robot', 'Ai', ... 'Earth_observation_satellite', 'Eclipsed_conformation', 'European_Union_Space_Programme', 'Expendable_launch_system', 'Fédération_Aéronautique_Internationale', "Gagarin's_Start", 'Geocentric_orbit', 'Geosynchronous_orbit', 'Ground_segment', 'Ground_station', 'Guidance,_navigation,_and_control', 'Inter-satellite_service', 'Intergalactic_travel', 'Orbital_inclination', 'Transponder_satellite_communications']
And additionally, lets create a Wordcloud with the same-named library.
from wordcloud import WordCloud

def wordcloud_for_cluster(c_id, lables):
    text = ' '.join([X['preprocessed'][i] for i,l in enumerate(lables) if l == c_id ])

    wordcloud = WordCloud(max_font_size=50, max_words=20).generate(text)
    plt.imshow(wordcloud, interpolation='bilinear')
    plt.axis("off")
    plt.show()

wordcloud_for_cluster(0, kmeans.labels_)
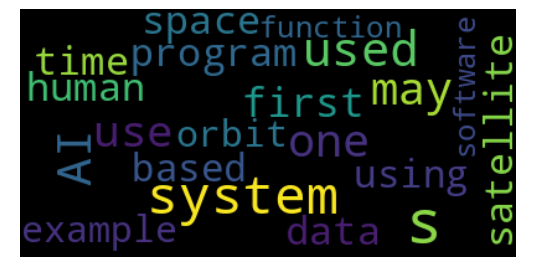
Hmm, several article about artificial intelligence intermixed with spacecraft? Although this “spot-check” of just one cluster from my first attempt with KMeans is just an impression of empirical data, the achieved clustering feels dissatisfying. There is no expected cluster separation, no expected labels to take granted.
So how to improve this clustering in the sense that artificial intelligence and spacecraft articles are more separated? This will be the task of the next article.
Project Learnings
During the project, I made several wrong assumptions and just plain programming errors because of unfamiliarity with the different libraries involved. This section briefly reflects these learnings in the hope that other might avoid them:
- SciKit learn consumes the complete matrix passed to it. When working with a Pandas DataFrame, be sure to only forward those columns that contain numerically data.
- SciKit learn algorithms only work with numeric data. You cannot pass preprocessed, tokenized text, and not dictionary objects representing word occurrences or frequencies.
- Decide to roll your own from-scratch algorithms or use the ones offered by libraries. On the one hand its educative to program from scratch, on the other hand it gets frustrating if you worked with the wrong assumptions. For text vectorization, all libraries provide simple Tokenizers and Vectorizers that you can use.
Conclusion
This article showed how to apply KMeans clustering to a set of documents from Wikipedia. Starting point is the creation of a corpus, a list of plaintext articles from Wikipedia about three different topics. These articles are consumed by a SciKit Learn pipeline to preprocess, tokenize, and bag-of-word encode the articles. To understand clustering practically, you saw an explanation of the KMeans example, which answered questions about the clustering algorithm setup and configuration, the input data, how to perform clustering and the output data. The last part of this article used KMeans on a vectorization of the bag of words. Alas, the clusters seemed not distinguishable enough, for example throwing artificial intelligence and spaceships into the same category. The next article investigates how to improve the clustering.