With Lighthouse you can quickly scan web pages for their performance, SEO and best practices. I provide lighthouse as a service, powered by microservices that run on Kubernetes. Read about my motivation and initial design considerations.
Over the past weeks, I have learned a lot about different subjects: Configuration management with Ansible. Service declaration, orchestration, discovery and monitoring with Nomad/Consul. Load balancing with Nginx. Web application development with Node.js and React. I want to put all these things together and develop a service. So I created a website scanner based on the Google Chrome extension Lighthouse.
Note: The lighthouse service is discontinued since 2024-05-18.
Motivation
While working on my webpage, I often used different website scanners. Scanners can be accessed just like a search engine: Enter a URL, and the report will be generated.
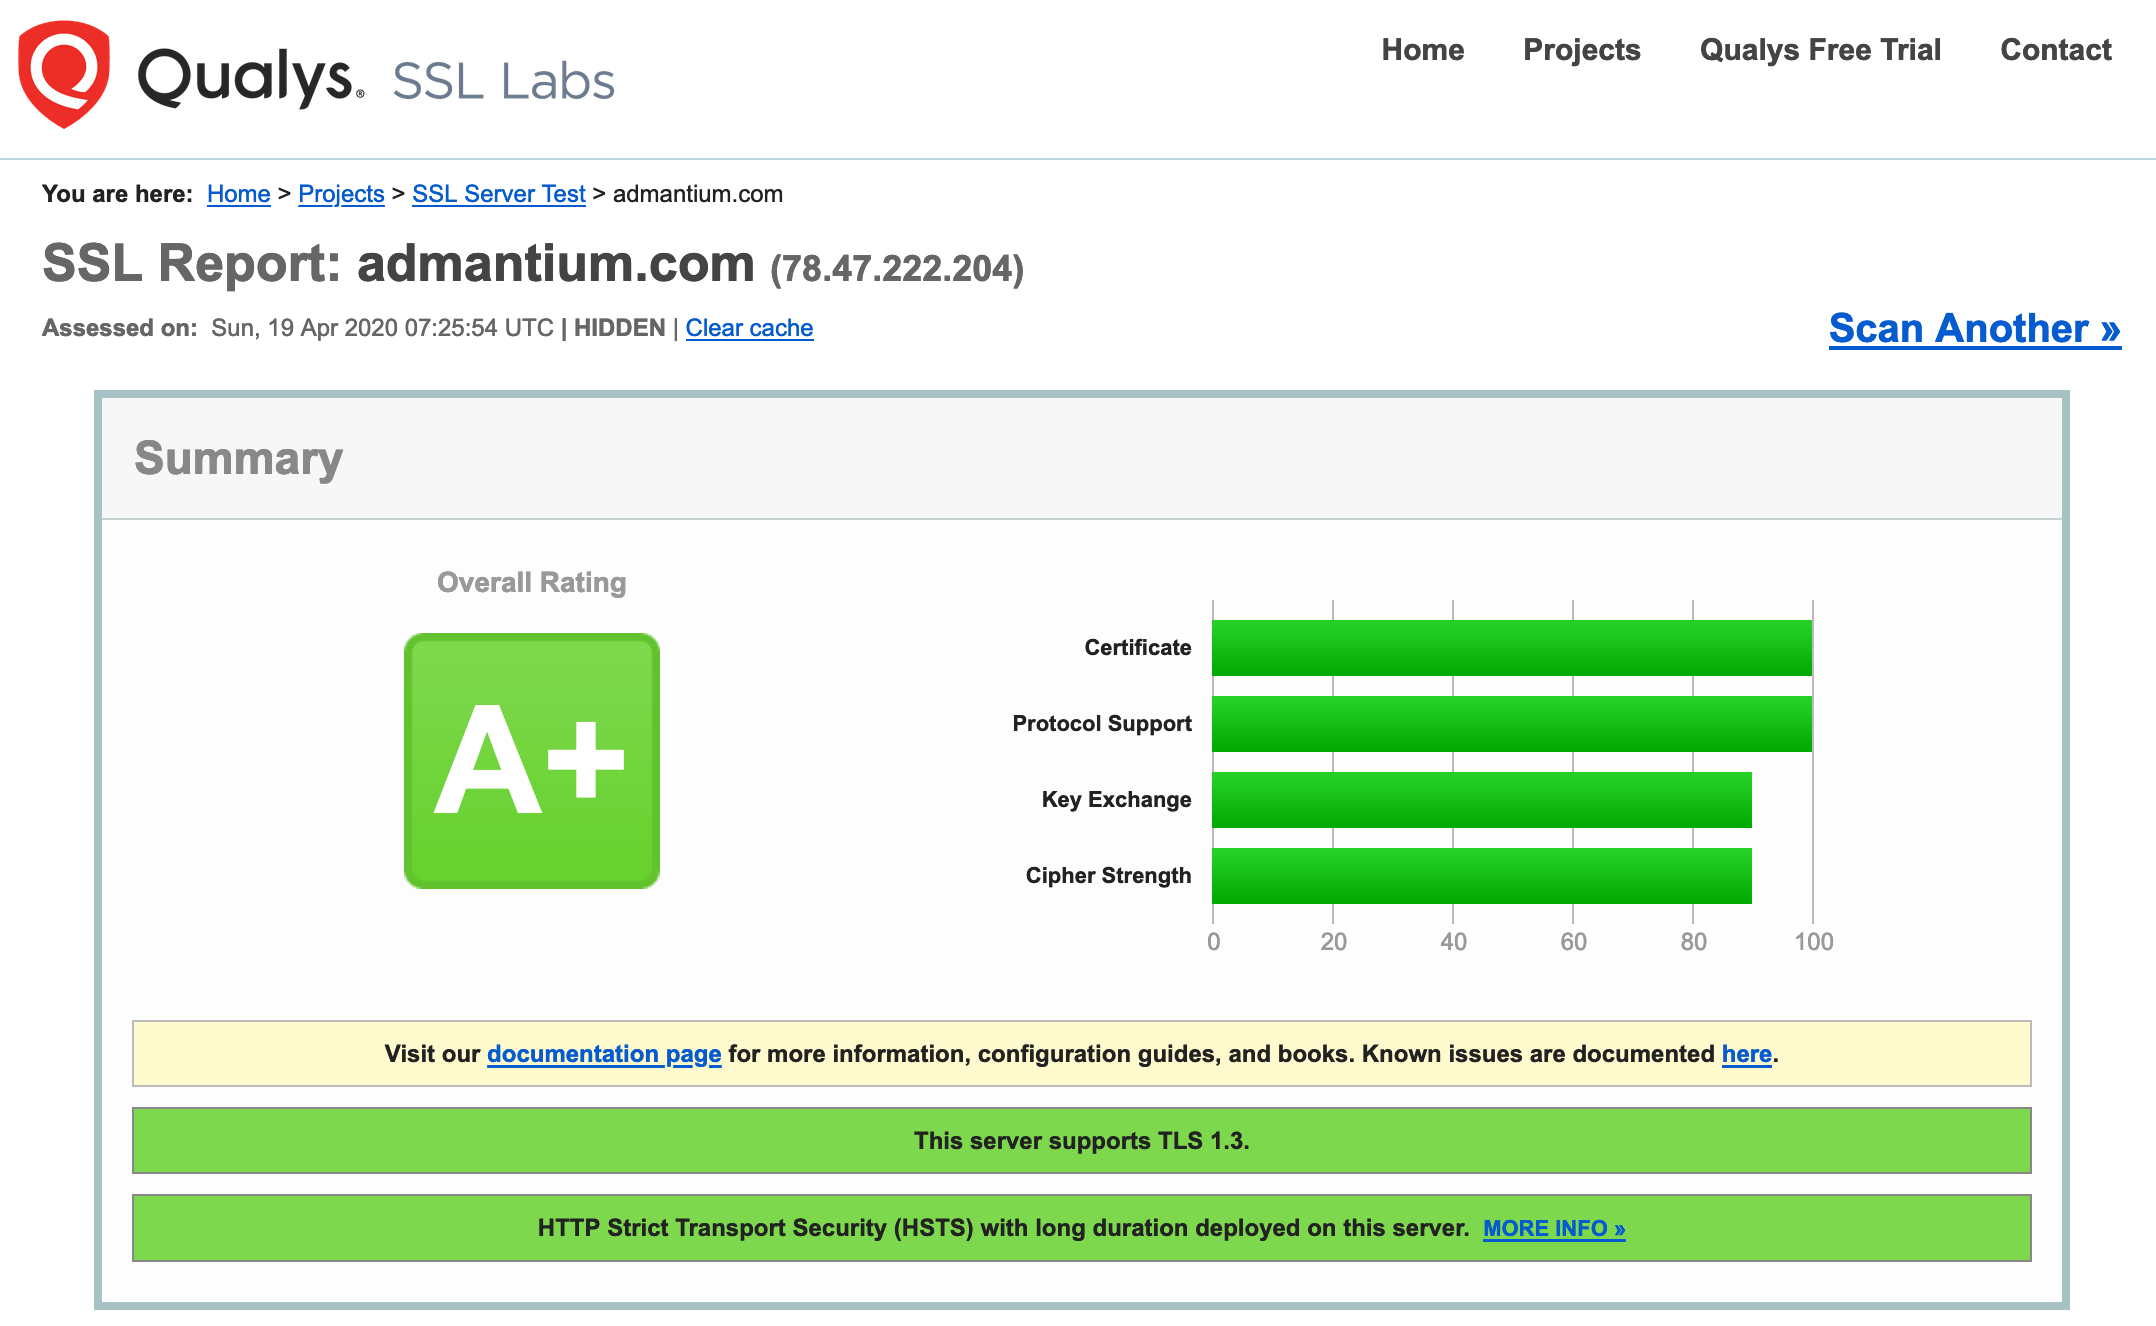
One example is SSL labs. They check how which TLS version are you using, which TLS Ciphers are available for encrypting traffic, and much more.

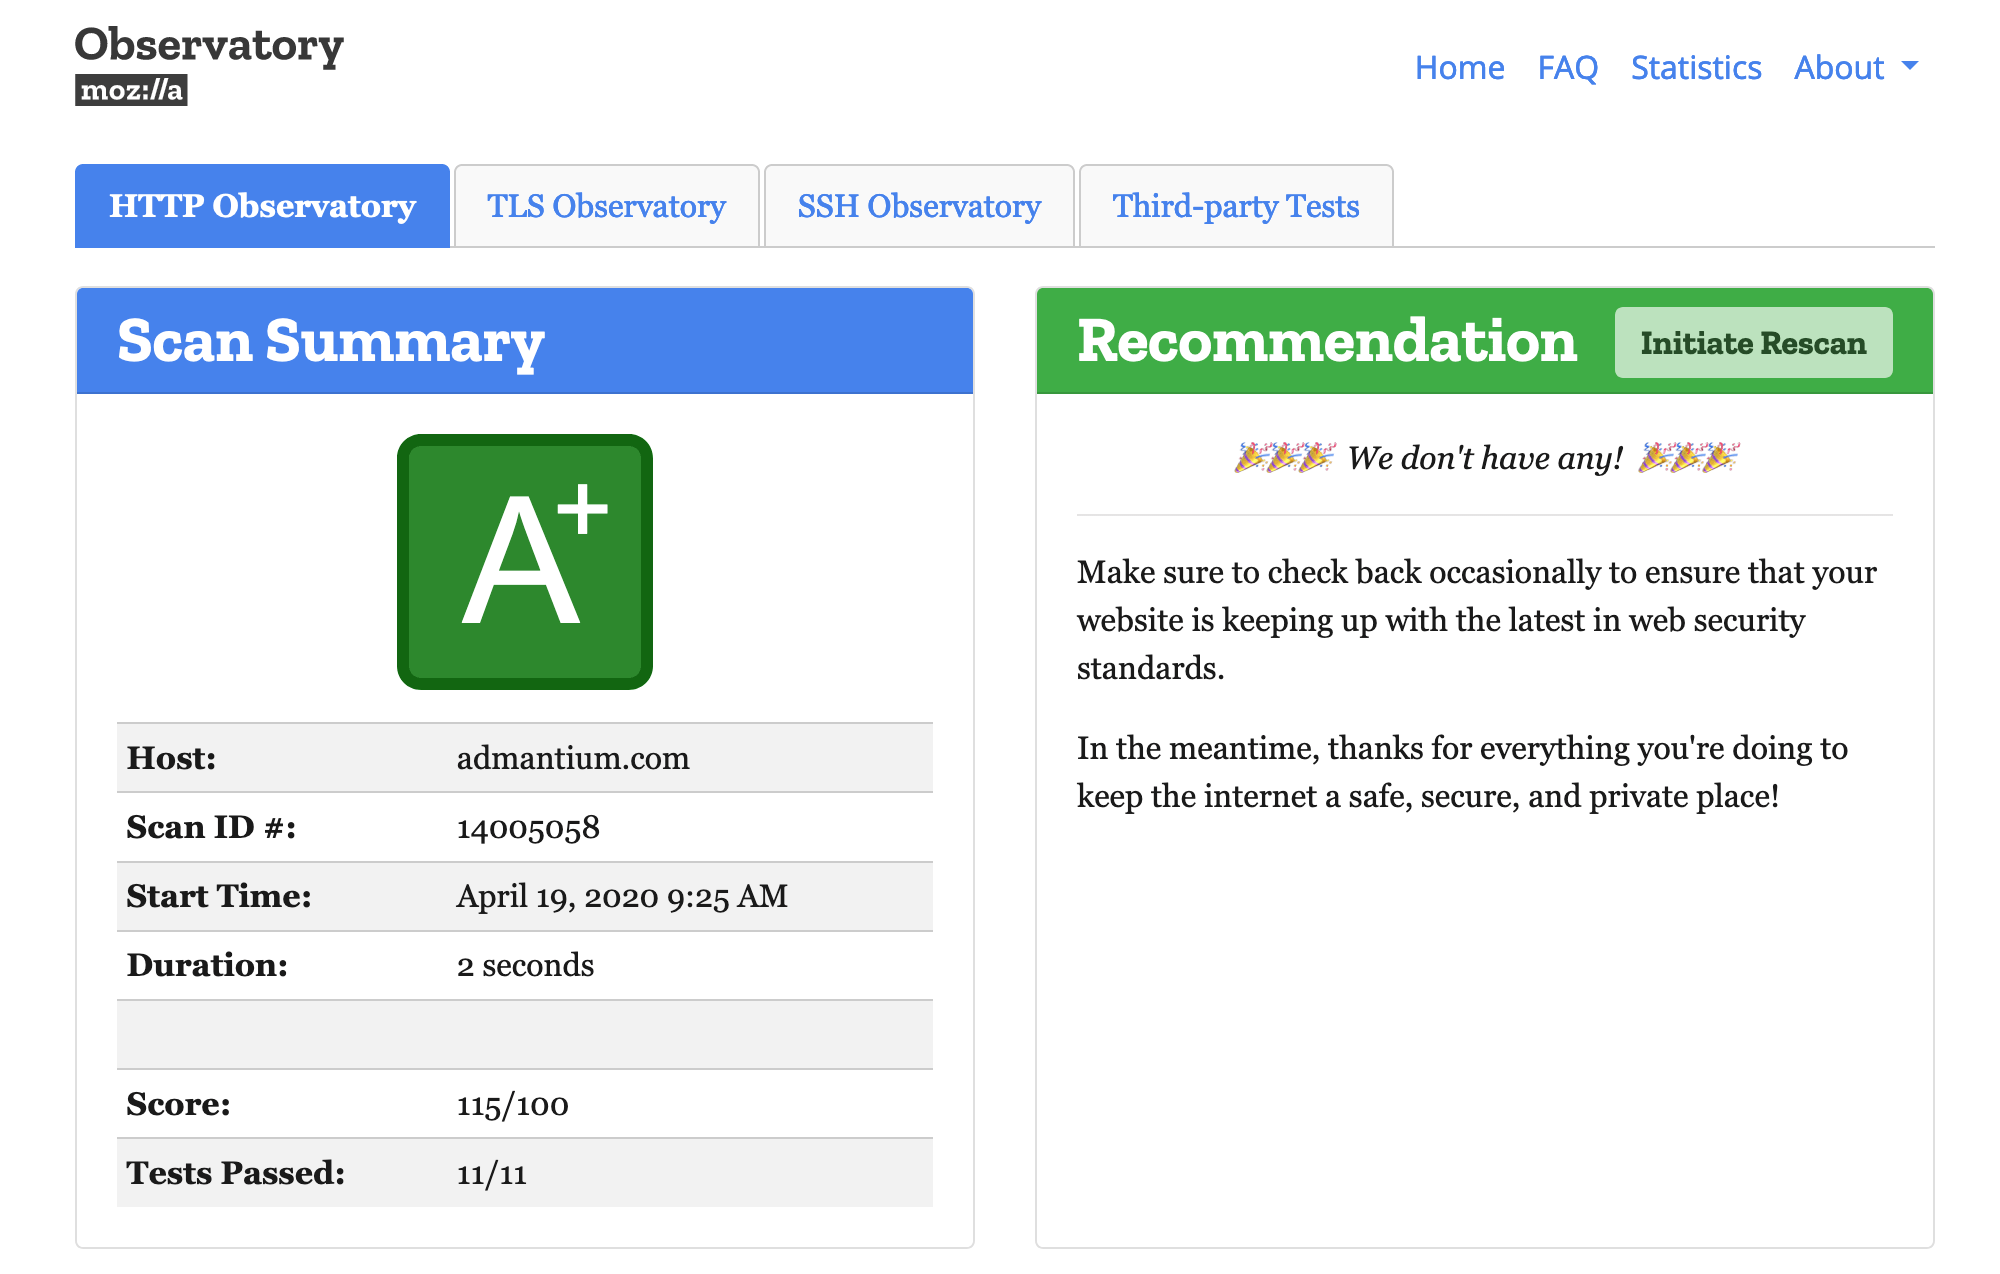
Mozilla Observatory checks if you use important HTTP headers and especially your Content Security Policy.

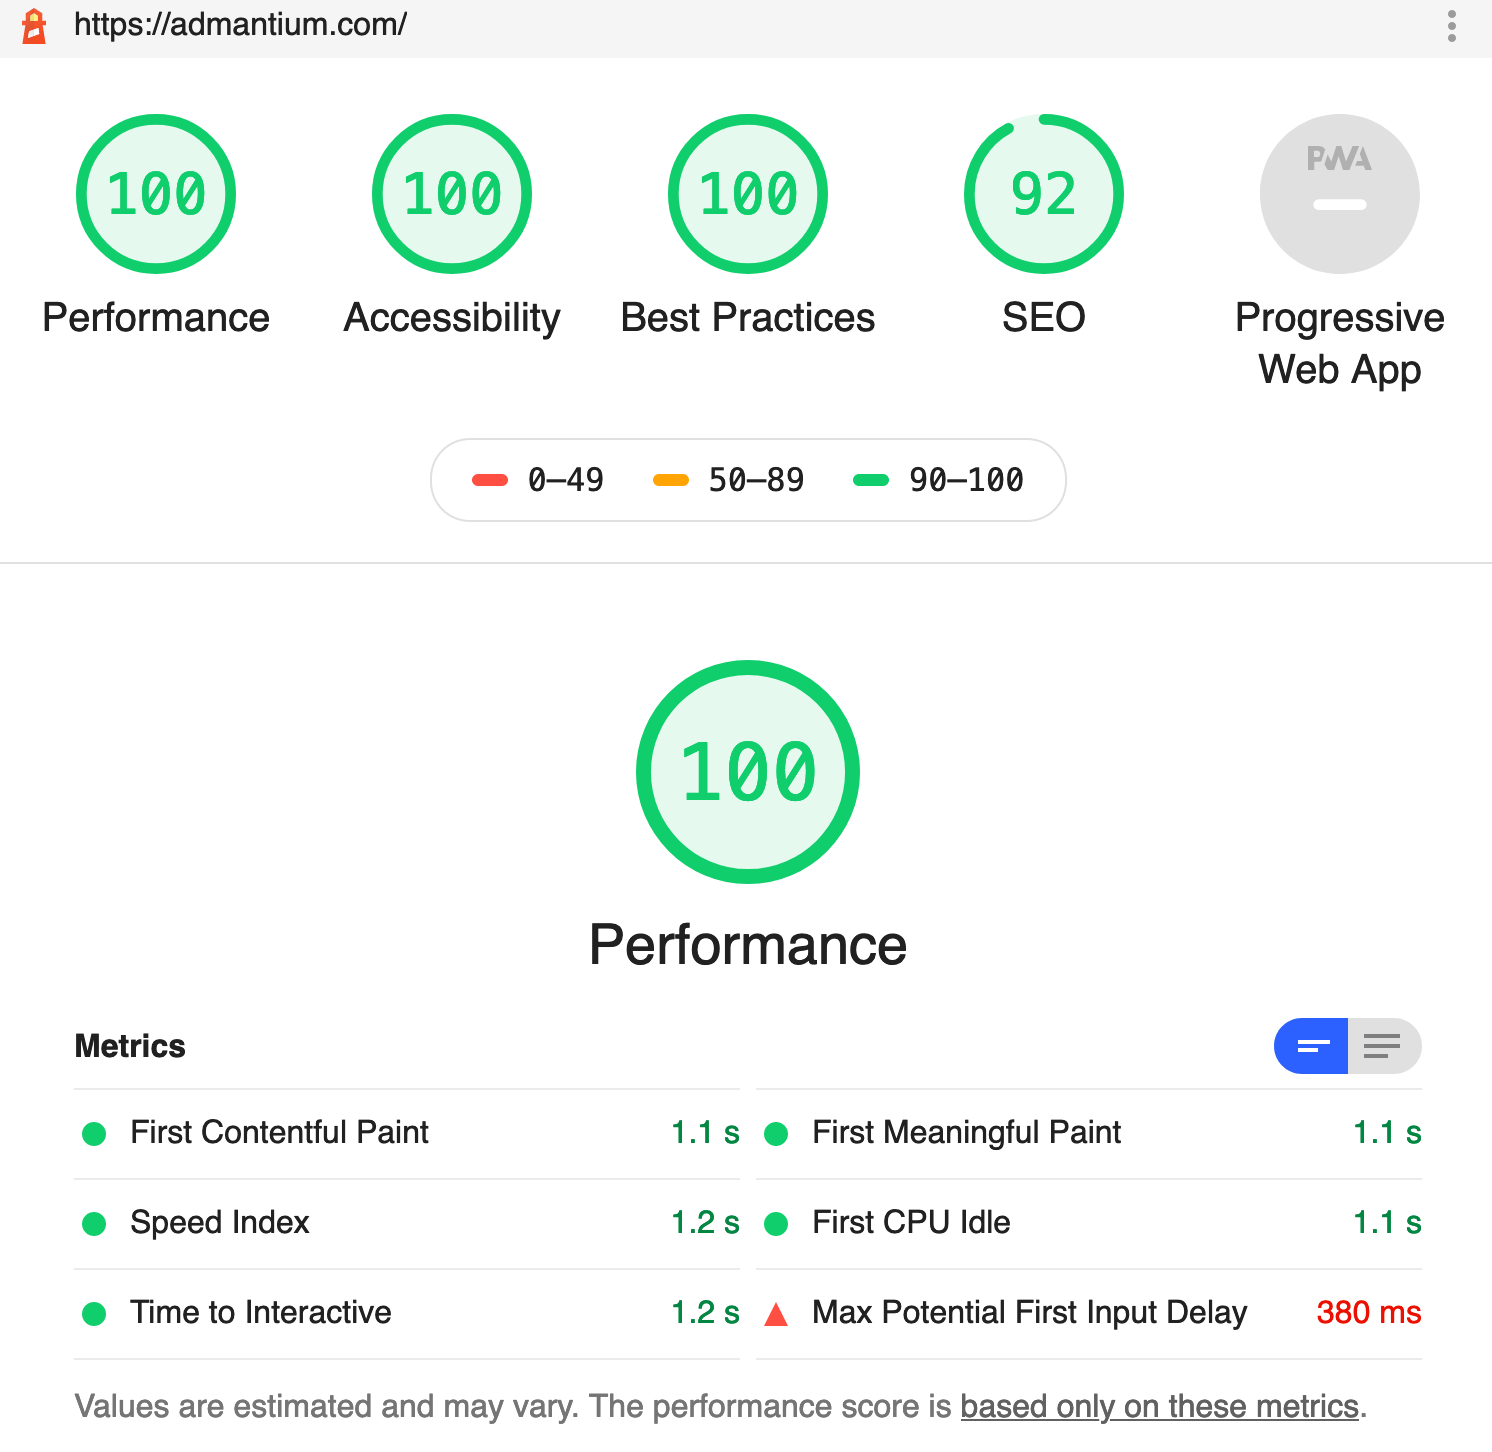
Another helpful tool is Lighthouse, a scanner for SEO, performance and security of websites. To run it, you need to use a Chrome or the npm package. Reports look like this:

Wouldn’t is be cool to run Lighthouse scan from a public webpage? I think so too!
System Design
Some time ago I started to use the lighthouse scanner by using npm package. To my great surprise the scans had very different execution times: 10 seconds to sometimes 50 seconds for heavy web page with lots of JavaScript. Because scan take an unknown amount of time, and because the process is heavy on CPU and RAM, naturally I came to the (unchallenged, and un-investigated) assumption: “I need an event-driven architecture”.
What are the components in this architecture? First of all, the Scheduler receives requests from clients. It generates jobs and puts them in a queue. From here, Scanner components can take a job and start the scan process. When they are done, they will mark the job as completed and upload the results. Clients can ask the scheduler about their job, and when the job is completed, they can download the results.
This sounds good, but what is the core problem that I want to solve with this approach? The service needs to distribute client requests to workers. Using an event queue introduces complexity: Items need to be put, consumed, marked. It also adds new components and functions that need to be well designed and tested. And it produces a new source of error when jobs get lost or corrupted.
Can I solve this challenge in another way? Can I reduce complexity in system design, while providing a more resilient system?
Let’s start again. The scanners main task is to perform the scans. When it receives a request, it checks its internal state. When it has enough capacity, it accepts the job. If it has not enough capacity, it denies the job. The client can then retry to ask later, or it can retry immediately with another scanner. This makes the scanner a horizontally scalable microservice. Service availability then becomes a question of load balancing the number of requests on all scanners so that requests can be handled efficiently.
I don’t need a scheduler. I need two essential components: A well-designed and performant scanner, and a frontend for clients. And I need to glue them together with reactive load balancing and monitoring so that enough scanners are available to handle the number of requests.
Scanner: API Endpoint
Let’s start to detail the system design from the bottom up: The HTTP API endpoints of the scanner. It will define three routes: /scan, /job and /report.
When a client wants to initiate a scan with /scan?url=http://example.com, the following steps will happen:
- Can the scanner accept another request?
- No: return
429with aRetry-Afterheader - Yes: continue
- No: return
- Is the
urlquery parameter included? And is it well formed?- No: abort, return
400 - Yes: continue
- No: abort, return
- Can the
urlbe resolved to an IP address?- No: abort, return
400 - Yes: continue
- No: abort, return
When all checks are successful, the client receives an 202 acknowledgement that the report will be generated. It also returns the UUID with which he can retrieve the report later.
The client now periodically accesses /jobs with the UUID. The scanner performs these checks:
- Is the UUID present?
- No: return
400 - Yes: continue
- No: return
- Is the UUID valid?
- No: return
400 - Yes: continue
- No: return
- Is the scan job finished?
- No: return
202 - Yes: continue
- No: return
- Is the scan job successful?
- No: return
500, and the report result. - Yes: continue
- No: return
When all checks are successful, the report can be fetched finally from /report.
Frontend Requirements
Ok, now we know the requirements of the Scanner component. Let’s think about how we, as users, interact with it.
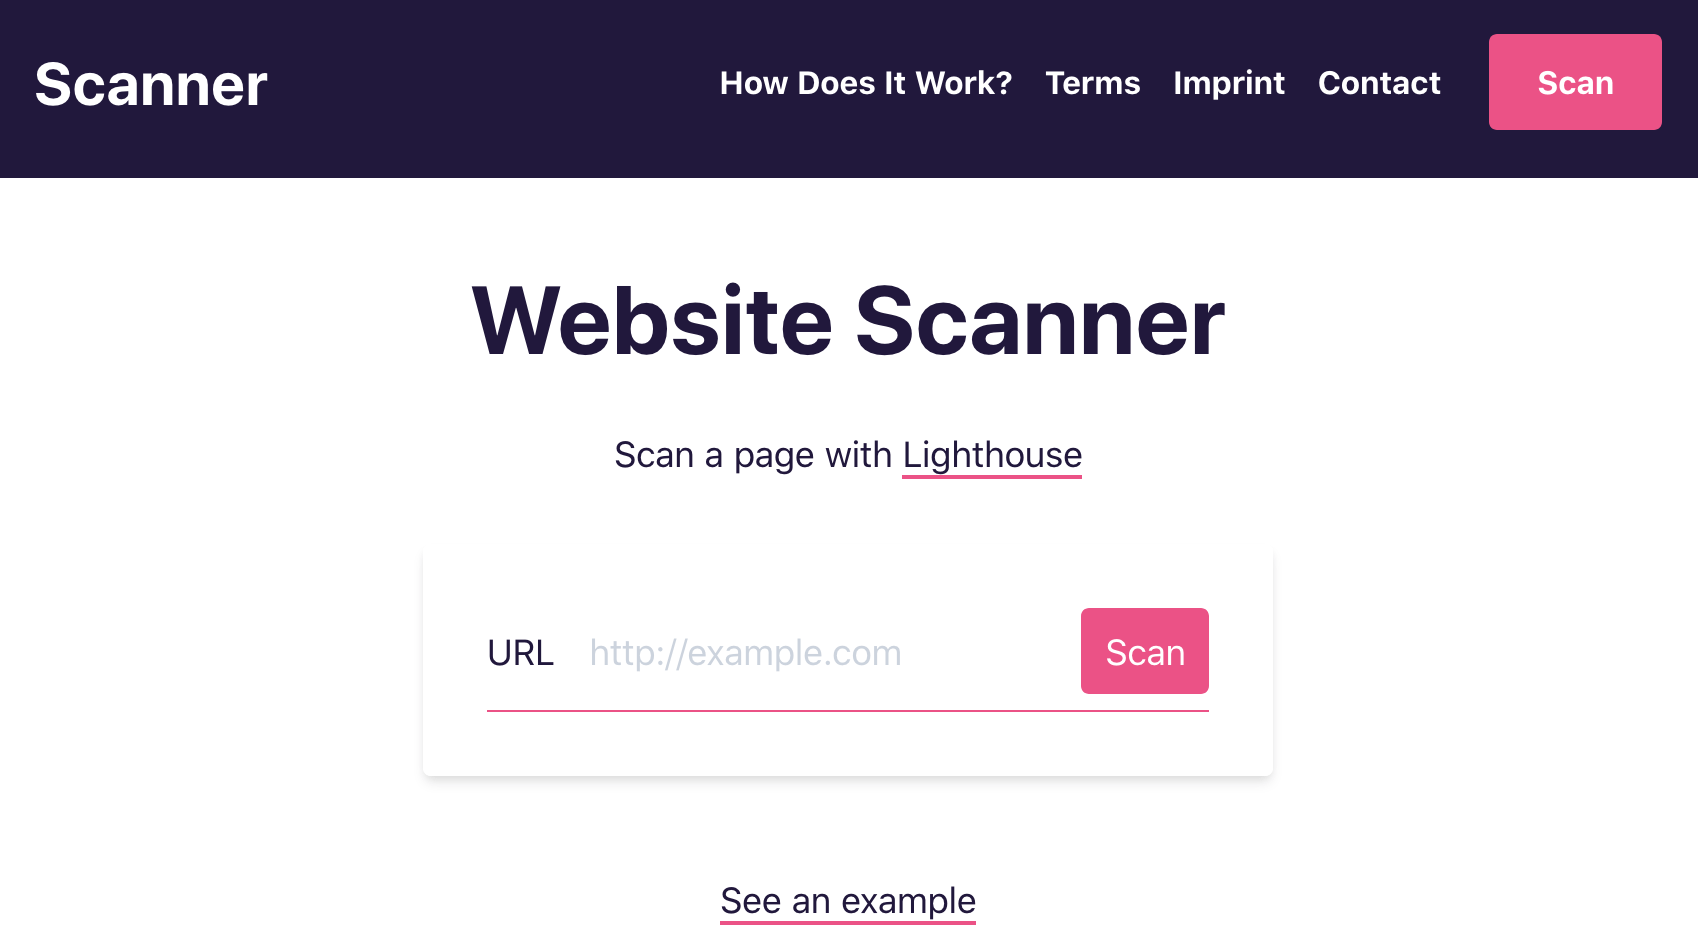
The scanner should be accessed via a webpage. It has one central element: The search bar. Users enter a webpage url, and send the scan job to the backend.

The frontend part needs to deal with all of the above-mentioned error cases. All messages are in JSON, so I can transport detailed error codes and messages. I will describe the different steps in the scanning process, and how the UI behaves:
- Requesting
/scan- Disable the search bar
- When receiving a
400or429error- show the error message below the search bar
- Enable the search bar
- When receiving a
202ok- show the success message
- open a progress bar
- Periodically request
/job- When receiving a
400error- disable progress bar
- show the error message below the search bar
- enable the search bar
- When receiving a
429error, retry - When receiving a
500error- disable progress bar
- show the error message below the search bar
- show the download link to the user
- enable the search bar
- When receiving a
200ok- disable progress bar
- show the message below the search bar
- show the download link to the user
- enable the search bar
- When receiving a
- Load the report from
/report- When receiving a
400error- show the error message below the search bar
- When receiving a
200ok- open the report in a new browser tab
- When receiving a
This is the general flow of the application. We have defined the core requirements of the two components.
Conclusion
This article introduced the Lighthouse as a Service scanner. I explained the system design, in which at first a distributed queue system was considered, and then the idea of an independent microservice was evaluated. Then I explained the API Endpoint requirements, the HTTP API with which scans can be initiated and reports returned. The frontend requirements detail how the user interacts with the system. In the next articles, I will show how the HTTP API and the frontend are developed.
