Fluent Bit is an amazing tool for logfile aggregation, processing and storing. Due to its flexible plugin architecture, each step of the processing pipeline from input, parser, filter, and output can be tailored to very specific data formats. And because of its small footprint on required computing resources, it’s also ideal to be used in an IOT context.
This article explains how to configure Fluent Bit to gather logfiles in an extended IOT environment. Particularly, you will learn how to collect log files from the system that Fluent Bit is installed on, how to collect the output of Docker containers, how to access logs from other systems, and finally reading logs from small IOT devices that are configured with ESPHome and Home Assistant.
The technical context of this article is Raspberry Pi OS 2024-11-19, Fluent Bit v2.2.3, Home Assistant v2024.10.4 and ESPHome v2024.10.3, but the instructions should work with newer releases as well.
Types of Logfiles in an IOT Environment
An IOT environment consists of several computers, single board computers, microcontroller and sensors. The devices typically use WiFi or Bluetooth for connectivity, and will communicate with various protocols such as HTTP, MQTT, ZigBee. While the specifics will vary, I assume that your IOT network consists of some of the following components, and produce the listed logfiles:
- System logs: general system logs, access logs, application logs from the computer that runs Fluent Bit
- External system logs: system logs, appliance-specific logs from other computers and appliances in your local network
- IOT applications: application-specific logs from applications that are installed or run as Docker containers
- Sensors: sensor log output from the sensors themselves, such as a microcontroller, or from a managing software like ESPHome or Home Assistant
The goal of this article is to show configuration options for accessing and storing these log files with Fluent Bit.
System Logs
To capture logs from the host system itself, we need to instruct Fluent Bit to tail the log files. In addition, we also need to mount the logfiles to the Fluent Bit container itself. Here is how:
services:
  fluentd:
    image: fluent/fluent-bit:2.0.6
    container_name: fluentbit
    volumes:
      - type: bind
        source: ./volumes/fluent-bit/
        target: /fluent-bit/etc
      - type: bind
        source: /var/log/
        target: /mnt/host/var/log/
    networks:
      - fluentd-logging
    command:
      - fluent-bit
      - -c
      - /fluent-bit/etc/fluent-bit.yaml
And the parser.conf needs to include the following config. Note that there is a tag attached to this input which is the system name that is parsed.
pipeline:
  inputs:
    - name: tail
      path: /mnt/host/var/log/*.log
      tag: nexus
  outputs:
    - name: stdout
      match: '*'
Example:
[6] nexus: [1679851501.177966587, {"log"=>"Nov 26 19:25:01 nexus CRON[5508]: pam_unix(cron:session): session opened for user root by (uid=0)"}]
[7] nexus: [1679851501.178823730, {"log"=>"Nov 26 19:25:01 nexus CRON[5509]: pam_unix(cron:session): session opened for user pi by (uid=0)"}]
[8] nexus: [1679851501.262999354, {"log"=>"Nov 26 19:25:01 nexus CRON[5508]: pam_unix(cron:session): session closed for user root"}]
[9] nexus: [1679851501.329486945, {"log"=>"Nov 26 19:25:01 nexus CRON[5509]: pam_unix(cron:session): session closed for user pi"}]
External System Logs
With the core system logs captured, lets continue to fetch logs from other computers and appliances in your IOT network.
If you are running Linux, you can use the syslog protocol to publish logfiles via the network. This protocol uses UDP on port 514 and is unencrypted, which results in the following consequences. First, UDP connections are not stateful, and therefore some messages might be dropped, so possibly losing some log messages. Second, only use this protocol as-is inside a trusted network, as you don’t want to send potentially sensitive data unencrypted over WAN or even Internet.
To use syslog in your network, you first need to configure the origin computer to send logfiles via syslog. And second you need to configure Fluent Bit to listen to these messages - use the following configuration stanza:
pipeline:
  inputs:
    - name: syslog
      port: 514
      listen: 0.0.0.0
      tag: external-system
That is all. If you need to capture log files from multiple computers, I recommend to I recommend duplicating this configuration and define different ports and tags to make a clear distinction about the origin of the logfiles.
With this setup, here is an example of capturing log files from my firewall appliance:
[0] nexus: [1679852062.647105151, {"log"=>"Nov 26 19:34:22 hermes.local kernel: FORWARDFW IN=blue0 OUT=red0 MAC=98:48:27:db:6a:08:3c:61:05:9c:3f:6b:08:00 SRC=192.168.4.216 DST=164.92.155.23 LEN=76 TOS=0x00 PREC=0x00 TTL=254 ID=34110 PROTO=UDP SPT=23904 DPT=123 LEN=56 MARK=0x80000000 "}]
[1] nexus: [1679852062.748267114, {"log"=>"Nov 26 19:34:22 hermes.local kernel: FORWARDFW IN=green0 OUT=red0 MAC=00:e0:4c:6b:44:0a:dc:a6:32:3c:e8:f8:08:00 SRC=192.168.2.200 DST=217.197.91.176 LEN=76 TOS=0x18 PREC=0xA0 TTL=63 ID=52576 DF PROTO=UDP SPT=123 DPT=123 LEN=56 MARK=0x80000000 "}]
[2] nexus: [1679852063.690479273, {"log"=>"Nov 26 19:34:23 hermes.local kernel: OUTGOINGFW IN= OUT=red0 SRC=192.168.2.100 DST=192.168.2.1 LEN=104 TOS=0x00 PREC=0x00 TTL=255 ID=13875 DF PROTO=ICMP TYPE=8 CODE=0 ID=29492 SEQ=3773 MARK=0x80000000 "}]
[3] nexus: [1679852065.700135856, {"log"=>"Nov 26 19:34:25 hermes.local kernel: DROP_INPUT IN=red0 OUT= MAC=84:39:be:69:48:1e:b0:4e:26:66:31:d4:08:00 SRC=192.168.2.1 DST=192.168.2.100 LEN=78 TOS=0x00 PREC=0x00 TTL=64 ID=0 DF PROTO=UDP SPT=41659 DPT=137 LEN=58 MARK=0x80000000 "}]
IOT Application Logs
Its hard to give a one-fir solution for all IOT application logs because they vary greatly in their use-case and installation process. My setup is based on the IOT stack, a Raspberry Pi compatible installation and configuration suite that creates a docker-compose.yml file to start interconnected Docker containers with IOT applications such as ESPHome, Home Assistant and InfluxDB. Therefore, the focus is how to capture the log output of these Docker containers.
Docker Application logs can be captures in two ways. First, you could consume the Docker daemons logfile on the target host - just add another logfile tailing configuration and mount the logfile inside the Fluent Bit container. Alternatively you can configure Fluent Bit as the logfile driver for the Docker containers.
I opted for the latter option. In the docker-compose.yml, you need to define the fluentd logging driver, and you need to ensure that both containers share the same network. An important restriction: The Fluent Bit container and the other Docker containers need to reside in the very same network. Use the following configuration stanza:
  service:

    networks:
      - fluentd
    logging:
      driver: fluentd
Apply this configuration step-by-step to all Docker containers, and always check that the log files appear. Here is an example output of the container influxdb captured with fluentbit:
ts=2024-11-26T17:36:57.285204Z lvl=info msg="Executing continuous query" log_id=0gokjnrW000 service=continuous_querier trace_id=0gokl7mG000 op_name=continuous_querier_execute name=cq_cpu_temperatures db_instance=telegraf start=2023-03-25T18:00:00.000000Z end=2024-11-26T17:00:00.000000Z
ts=2024-11-26T17:36:57.285395Z lvl=info msg="Executing query" log_id=0gokjnrW000 service=query query="SELECT mean(temperature) AS temperature, mode(node) AS node INTO telegraf_historic.autogen.cpu_temperature FROM telegraf.autogen.cpu_temperatures WHERE time >= '2023-03-25T18:00:00Z' AND time < '2024-11-26T17:00:00Z' GROUP BY time(1h), *"
ts=2024-11-26T17:36:57.285991Z lvl=info msg="Finished continuous query" log_id=0gokjnrW000 service=continuous_querier trace_id=0gokl7mG000 op_name=continuous_querier_execute name=cq_cpu_temperatures db_instance=telegraf written=0 start=2023-03-25T18:00:00.000000Z end=2024-11-26T17:00:00.000000Z duration=0ms
ts=2024-11-26T17:36:57.286064Z lvl=info msg="Continuous query execution (end)" log_id=0gokjnrW000 service=continuous_querier trace_id=0gokl7mG000 op_name=continuous_querier_execute op_event=end op_elapsed=0.928ms
ESP Home Sensors
Capturing Sensor logfiles is the final frontier, and again its hard to suggest a one-fit solution too.
During the initial investigation, I followed two ideas that are related to my IoT stack, based on two applications. First, all sensors are configured with the ESPHome software, a unique and powerful way to manage sensors by just describing their configuration as a YAML file. Second, Home Assistant, an all encompassing sensor integration and automation platform that interacts with ESPHome and other applications to access their sensors. Given that, I investigated if I could get sensor logfiles from these two devices.
With ESP Home, once a sensor is flashed, they can be accessed from a dashboard which will also show log files produced by the sensor. Digging into the tech stack, I learned that the Protobuf protocol is used for internal communication between the dashboard and the sensor. However, I could not find a documentation showing the specifics of this protocol and how to capture the communication with a third-party tool, and I also could not find a log exporter functionality from ESPHome.
In Home Assistant, a ESPHome compatible sensor can be integrated. By configuring the sensor to give debug information, I was able to get simple metrics and store them inside InfluxDB, as reported in an earlier article. Can I use this to capture log files too? Unfortunately not - the integration only captures pure sensor data.
With this understanding I tried another approach. ESPHome sensors can be configured to use MQTT for communicating sensor data. Can they also output their log files via this stream? Then I just need to configure FluentBit to listen to MQTT. Checking the ESPHome Logger component documentation gives an encouraging fact: “The logger component automatically logs all log messages through the serial port and through MQTT topics …”. Let’s try this.
First, enable MQTT for a sensor inside ESP Home as follows. You need to configure the IP address, username and password, and define the log topic and which level of log messages you want to publish.
mqtt:
  broker: '192.128.100.10'
  username: 'REDACTED'
  password: 'REDACTED'
  topic_prefix: nodes/esp8266-dht
  log_topic:
    topic: nodes/esp8266-dht/log
    level: DEBUG
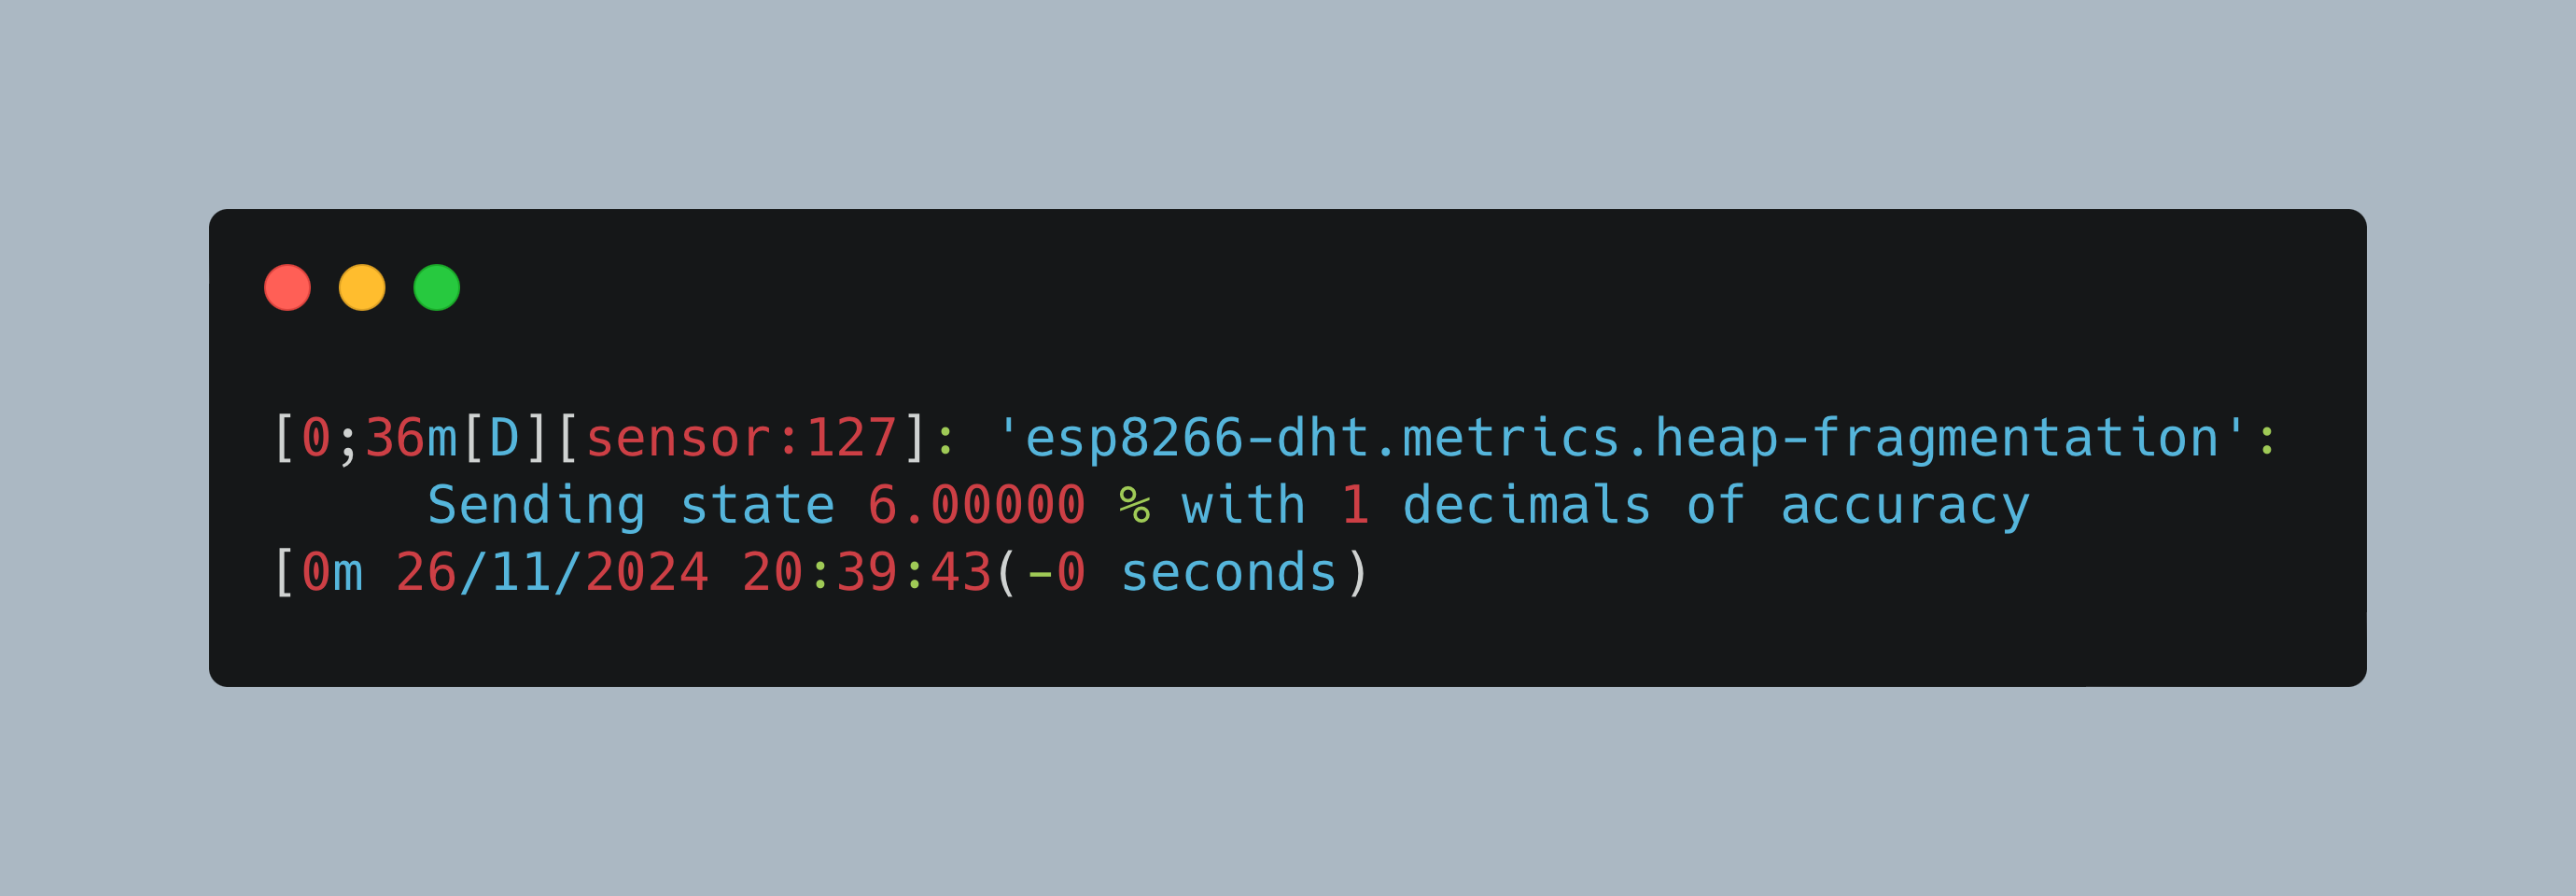
After flashing the sensor, checking the MQTT messages with a suitable broker showed this:
[0;36m[D][sensor:127]: 'esp8266-dht.metrics.heap-fragmentation': Sending state 6.00000 % with 1 decimals of accuracy[0m
26/11/2024 20:39:43(-0 seconds)
[0;36m[D][sensor:127]: 'esp8266-dht.metrics.heap-max-block': Sending state 18032.00000 B with 0 decimals of accuracy[0m
26/11/2024 20:39:43(-0.6 seconds)
[0;36m[D][sensor:127]: 'esp8266-dht.metrics.heap-free': Sending state 27192.00000 B with 0 decimals of accuracy[0m
26/11/2024 20:39:38(-4.92 seconds)
[0;36m[D][sensor:127]: 'VCC': Sending state 3.00586 V with 2 decimals of accuracy[0m
26/11/2024 20:38:55(-42.48 seconds)
[0;36m[D][sensor:127]: 'Living Room Humidity': Sending state 48.00000 % with 0 decimals of accuracy[0m
26/11/2024 20:38:55(-0.01 seconds)
Cool, it logs debug messages, and of course all sensor measurements which are redundant but can be filtered out with Fluent Bit.
However, I decided to stop here: These log messages are not important to understand a sensors health, since recording sensor data is already checkes with my other dashboards and sensor data already present in InfluxDB. If you want to continue, you need to configure FLuentBit to listen to MQTT messsages, which it will do, but only in server mode. If you have another MQTT server running in your IOT network, you need to setup a MQTT bridge so that the server copies all messages to Fluent Bit.
Logfile Visualization
The log files are defined as simple time database entries with their complete text data. You could query them manually but having an accessible dashboard with several viewing and filtering options is better.
During my research, I stumbled upon the logfile component in Grafana and Chronograph, a dedicated time series database visualization tool from the same company that delivers InfluxDB, and which also has a logfile viewer component.
I want to try both options, but first let’s define the concrete goal for an accessible dashboard:
- Categorize log files types (info, debug, warning, error)
- Filter logs for specific origins (computer, processes, Docker containers)
- Extract fields and values from the log messages
- Visualize the number of logs per timespan or per specific keyword
- Optional: Visualize changes in field/values of log files (for example status flag turning from ‘unavailable’ to ‘available’)
Grafana Logfile Component
Grafana is a universal metrics visualization tool working with several input sources and databases such as InfluxDB. To visualize log files, perform the following steps:
- Configure a new data source “InfluxDB Logs” by providing the IP address and port to your InfluxDB server, and then select the database containing the log file measurements:

- Go to “Dashboard” / “Browse”
- Select “New” / “New Dashboard”
- Add a new panel, and set its type to “Log”
- Select the InfluxDB Logs database, and enter a query. The query definition was a bit confusing: You need to apply the filter
uniqueto the log column in order to get meaningful results. The query that I was using is this:
SELECT distinct("log") FROM "75371422f9f9" WHERE time >= now() - 7d and time <= now() GROUP BY time(1s) fill(null)
- Click apply
This should provide you with the following dashboard:

Considering the features, following is fulfilled:
- ✅ Filter logs for specific origins (computer, processes, Docker containers)
- ✅ Extract fields and values from the log messages
- ✅ Visualize the number of logs per timespan or per specific keyword
Chronograph
Chronograph is part of the IOT stack, a unique project that provides a CLI menu to configure several interrelated IOT applications. Check my earlier article to get introduced to this amzing software. Adding Chronograph results in the following entry in the docker-compose file:
chronograf:
  container_name: chronograf
  image: chronograf:1-10
  restart: unless-stopped
  environment:
  - TZ=Etc/UTC
  - INFLUXDB_URL=http://influxdb:8086
  ports:
  - "8888:8888"
  volumes:
  - ./volumes/chronograf:/var/lib/chronograf
  depends_on:
  - influxdb
  - fluentd
  networks:
  - default
  logging:
    driver: fluentd
Start this container, then access it via the configured port and you are presented with the dashboard immediately. As with Grafana, you first need to add the InfluxDB database, Then, on the side bar, click the Log Viewer icon. The first time I used this, I only saw an empty dashboard. Checking the log files of InfluxDB, I could interfere the query that Chronograph attempts:
ts=2023-04-01T17:04:51.637899Z lvl=info msg="Executing query" log_id=0gwSFoEG000 service=query query="SELECT severity AS severity, timestamp AS timestamp, message AS message, facility AS facility, procid AS procid, appname AS appname, hostname AS hostname, host AS host, timestamp % 1000000 AS _timestamp_nsinms FROM fluent.autogen.syslog WHERE time >= '2023-04-01T15:59:29.083Z' AND time < '2023-04-01T15:59:59.083Z' AND message =~ /nexus/ ORDER BY time DESC"
This fails because the data is structured completely different. Going back to the most recent Chrongraf v1.10 documentation, I read this:
Logs are pulled from the syslog measurement. Other log inputs and alternate log measurement options will be available in future updates.
No way to customize it! The log viewer component can only be used on syslog messages and assumes a database in which each field is a separate column. Sadly the dashboard just stays empty:

Another option is the normal table viewer. Applied to logfiles, this looks as shown:

But this view does not give me any of the features we have seen in Grafana. I stopped here. During writing, I had the idea that I could use Fluent Bit to parse the raw data stream and transform it into a data format that Chronograf likes to visualize. But I will save this idea for the future.
Conclusion
Systematic logfile aggregation in an IOT network comprising core server, remote server, IOT applications, Docker containers, and sensors can be challenging. In this article, I showed how to solve each of these when using Fluent Bit. By configuring dedicated input plugins that tail log files, serve as logsys servers, usage as Docker log driver or listen to MQTT messages, you capture logfile streams systematically. Then, process them by giving meaningful tags, apply filters, and store them at a desired output location. When storing in InfluxDB, you get the additional benefit of time-based entries that can be visualized with Grafana and Prometheus. Grafana is easy to setup and has powerful visualization capabilities that help you to filter the logfiles for specific information.