In a growing network of IOT sensors and computer devices, getting quick access to essential log files is a challenge. On the one side, you have docker containers that host applications like Home Assistant or ESPHome. On another side, you have sensors that produce sensor readings, values, and log files as well. And finally, you have computers or special appliances like a firewall that also generates log files. Now, if there is an error, where do you start? Will you manually log into the systems and check the log files?
In this article, you will learn how to design and implement centralized logging with Fluent Bit. This high-performance program a versatile tool that reads, transforms, and stores or outputs logfiles from and to different providers, including Docker, systemd, and custom TCP or HTTP endpoints. You will learn about the setup, configuration, and log file exploration. The practical context of this article is my own IOT home network with a Raspberry Pi, Docker Containers, and several sensors.
The technical context of this article is Raspberry Pi OS 2024-11-19 and Fluent Bit v2.2.3, but the instructions should work with newer releases as well.
FluentD and Fluent Bit
This section introduces the two flavors Fluentd and Fluent-Bit before concluding which version will be used in the remainder of this article.
FluentD
Fluentd is a small binary that runs on any Linux computer including a Raspberry Pi. Once installed and started as a demon, it will watch for incoming log events, match them against is configuration, and then store or forward them.
Fluentd is a very flexible tool - several plugins along the input to output transformation can be loaded and used for very specific purposes. The high-level overview to these plugins is as follows:
- Input: Define additional input sources the fluentd listens to, including TCP, UDP and Unix sockets, HTTP, and tailing files.
- Parser: Flexible configuration of additional message parsing, including CSV, TSV, JSON, MessagePack and generic regular expressions.
- Filter: The filter plugin modifies the messages by dropping them entirely, adding or removing fields, or hiding fields for example to protect cleartext passwords. Concrete filter examples are grep and the record transformer which e.g., summarizes several log files.
- Output: Output can be written immediately or buffered, deferring writing until e.g., several log messages has been collected. The offered plugins are quite versatile: Output can be copied to multiple other sources, including other fluentd instances, and long-term storage includes MongoDB, Hadoop or an S3 bucket.
- Formatter: Additional helpers to transform the output message into a format compatible with the desired output plugin. Concrete formatters are JSON, CSV, MessagePack
- Storage: To ensure operational efficiency, the internal state of fluentd can be stored in external system. In the case that fluentd needs to be restarted, it can resume its state. Storage plugins exist for MongoDB, Redis, and Memcache.
- Service Discovery: With this plugins, other fluentd instances designated as output can be configured dynamically by providing a file or SRV record that is periodically checked.
- Buffer: These plugins enable additional buffered output options, memory and file buffers are supported.
- Metrics: Expose metrics about fluentd itself, such as the efficiency of total count of input, output or filter operations. Metrics are exposed in a JSON-like data structure.
Fluent Bit
Fluent Bit was started in 2014 when the developers of FluentD saw the need for running log file aggregation on systems with constrained resources like Embedded Linux devices. Its design goals are performance and interoperability. Because of a flexible plugin architecture, Fluent Bit was also used in cloud environments and has a strong usage base in this domain. The main difference from a technological viewpoint is that FluentD is built with Ruby and C, while Fluent Bit is entirely written in C and comes as 650Kb binary according to this comparison page.
Like the original project, Fluent Bit offers several plugins:
- Input: Configure the principal input types from an impressive list such as collectd, statsd, Docker logs and events, or complete technologies like MQTT and Node Exporter
- Parser: Transform the structure of the log event for a better consumption upstream, such as converting to JSON or using regular expressions to transform into any source
- Filter: Further fine granular modification of the log events to match or exclude events or to enrich them with custom metadata. Several interesting use cases are supported, such to enrich IP addresses with geo information, to add Kubernetes specific metadata, or even to run Tensorflow models with the content of log messages.
- Buffer: In constrained environments, additional options for buffering log messages before they can be processed might be needed.
- Router: The final stage of processing is to forward the logs to the consumer. This process relies on tags being applied to the log events, and matchers that react to these tags to be defined.
- Output: Finally the log event is forwarded to an impressive list of outputs, including basic options like file or HTTP, and again several concrete technologies such as Prometheus, Elastic Search or InfluxDB.
Which tool to use?
During the writeup for this article, I started with FluentD first. For writing logs files to InfluxDB, a complete tutorial article exists. The critical point is that you need to install additional plugins and configure them properly. This works when FluentD is installed natively on the system, but when running as a Docker container, you would need a customer Dockerfile with all these configuration steps.
Instead, Fluent Bit offers out-of-the-box support for InfluxDB, no additional plugins need to be installed. It also offers Docker images compatible with an ARM Linux, which the Raspberry Pi OS uses. Also considering that Fluent Bit is the younger project and is based entirely on the C programming language, I choose to continue with this.
Fluent Bit Docker Installation and Configuration
Fluent Bit is provided as a complete Docker image. Embedded into a docker-compose.yml file, you can mount directories from the host to provide the configuration file and additional access to the host as required.
Already anticipating that system log files should be fetched, I use the following custom configuration that mounts both a configuration file and the parser.conf file that determines how log files should be parsed.
services:
  fluentbit:
    image: fluent/fluent-bit:2.2.3
    container_name: fluentbit
    volumes:
      - type: bind
        source: ./volumes/fluent-bit/
        target: /fluent-bit/etc
      - type: bind
        source: /var/log/
        target: /mnt/host/var/log/
    networks:
      - fluentd-logging
    command:
      - fluent-bit
      - -c
      - /fluent-bit/etc/fluent-bit.yaml
Fluent Bit can be configured with ini-style text files or with YAML. Although using YAML is still defined as tech preview, I had no problems with the configuration at all.
Let’s start with a basic configuration with which Fluent Bit will watch changes in actual log files and forward any changes to stdout.
pipeline:
  inputs:
    - name: tail
      path: /mnt/host/var/log/*.log
      tag: nexus
  outputs:
    - name: stdout
      match: '*'
When starting both Docker containers, Fluent Bit will output log file changes:
[2] nexus: [1679850361.616388472, {"log"=>"Mar 26 19:06:01 nexus CRON[1473]: pam_unix(cron:session): session opened for user root by (uid=0)"}]
[3] nexus: [1679850361.621528441, {"log"=>"Mar 26 19:06:01 nexus CRON[1474]: pam_unix(cron:session): session opened for user pi by (uid=0)"}]
[4] nexus: [1679850361.696900558, {"log"=>"Mar 26 19:06:01 nexus CRON[1473]: pam_unix(cron:session): session closed for user root"}]
[5] nexus: [1679850361.778212768, {"log"=>"Mar 26 19:06:01 nexus CRON[1474]: pam_unix(cron:session): session closed for user pi"}]
Capturing Docker Log Files
With the above proof-of-concept working, we now configure Fluent Bit to also capture the output of all other Docker containers and to store the log files in InfluxDB. Three steps are required:
- Configure Fluent Bit to listen to Docker logs
- Add InfluxDB as a Fluent Bit output
- Configure the Docker containers to use the fluentd logging driver.
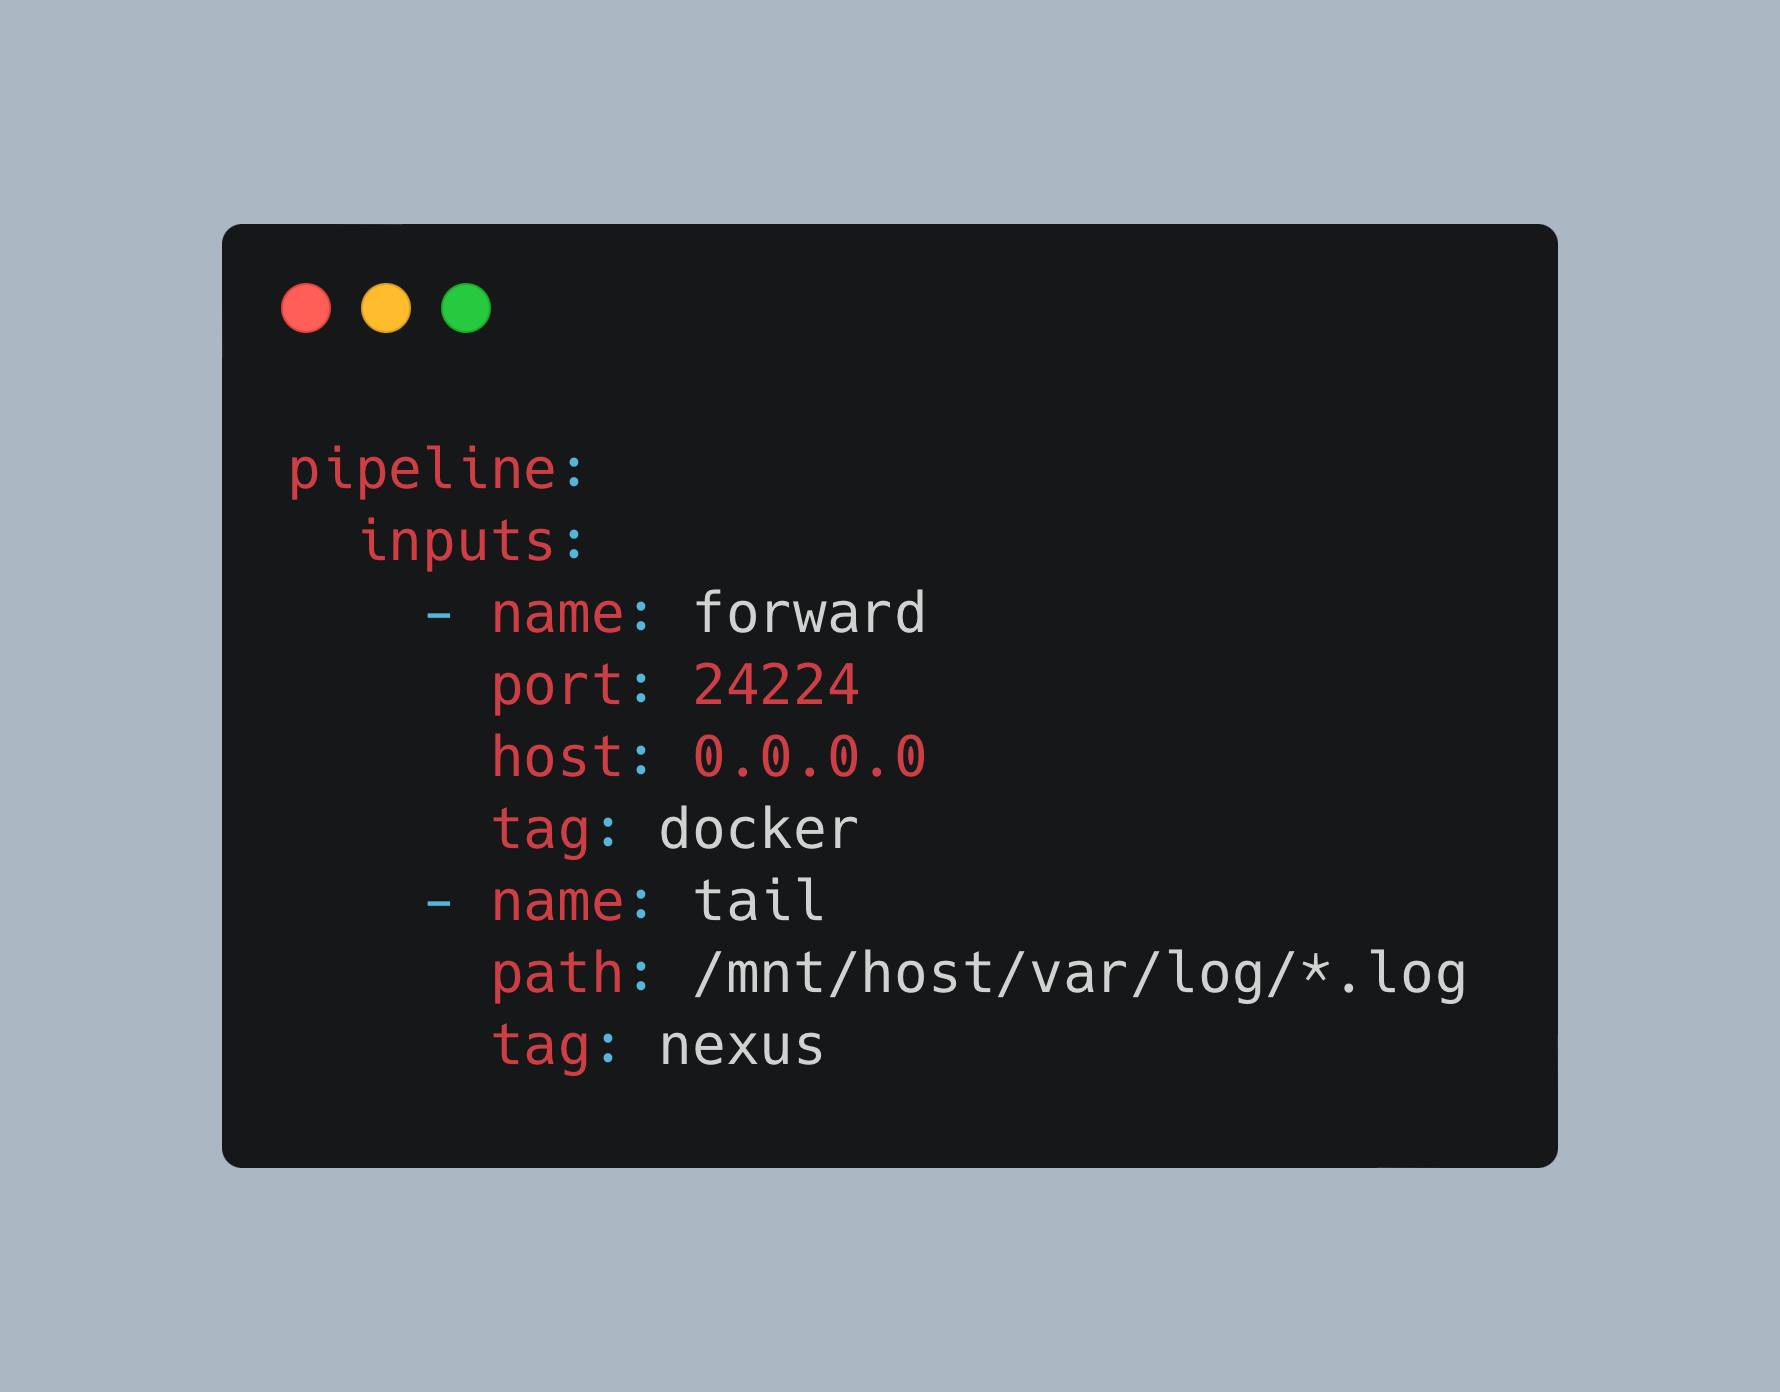
First, change the Fluent Bit configuration to this:
pipeline:
  inputs:
    - name: forward
      port: 24224
      host: 0.0.0.0
      tag: docker
    - name: tail
      path: /mnt/host/var/log/*.log
      tag: nexus

  outputs:
    - name: stdout
      match: '*'
    - name: influxdb
      match: '*'
      host: influxdb
      port: 8086
      database: fluent
Second, download the parsers.conf from the official repo, mount it into the Fluent Bit container, and change the startup script to this:
services:
  fluentbit:
    image: fluent/fluent-bit:2.2.3
    container_name: fluentbit
    volumes:
      - type: bind
        source: ./volumes/fluent-bit/
        target: /fluent-bit/etc
      - type: bind
        source: /var/log/
        target: /mnt/host/var/log/
    ports:
      - "24224:24224"
      - "24224:24224/udp"
    networks:
      - fluentd
    command:
      - fluent-bit
      - -c
      - /fluent-bit/etc/fluent-bit.yaml
      - -R
      - /fluent-bit/etc/parsers.conf
Third, in the docker-compose.yml file, you need to add the logging configuration to the container and ensure that it runs in the same Docker network as the Fluent Bit container too. Here is an example for modifying the telegraf container:
  telegraf:
    container_name: telegraf
    # ...
    networks:
      - fluentd
    logging:
      driver: fluentd
In my Docker container stack, Telegraf constantly logs when metrics are collected/added to a buffer and written to its configured outputs - enough log verbosity to get us started. After a docker-compose up --force-recreate -d telegraf, all container logs will be captured by fluent-bit:
[125] 75371422f9f9: [1679851058.000000000, {"container_name"=>"/telegraf", "source"=>"stderr", "log"=>"2023-03-26T17:16:21Z D! [outputs.influxdb] Buffer fullness: 0 / 10000 metrics", "container_id"=>"75371422f9f964ecc698d92d5b38a8f1338bb01c90b3aab55acf3e7982ae15f6"}]
[126] 75371422f9f9: [1679851058.000000000, {"container_name"=>"/telegraf", "source"=>"stderr", "log"=>"2023-03-26T17:16:31Z D! [outputs.influxdb] Buffer fullness: 0 / 10000 metrics", "container_id"=>"75371422f9f964ecc698d92d5b38a8f1338bb01c90b3aab55acf3e7982ae15f6"}]
[127] 75371422f9f9: [1679851058.000000000, {"log"=>"2023-03-26T17:16:41Z D! [outputs.influxdb] Buffer fullness: 0 / 10000 metrics", "container_id"=>"75371422f9f964ecc698d92d5b38a8f1338bb01c90b3aab55acf3e7982ae15f6", "container_name"=>"/telegraf", "source"=>"stderr"}]
[128] 75371422f9f9: [1679851058.000000000, {"container_id"=>"75371422f9f964ecc698d92d5b38a8f1338bb01c90b3aab55acf3e7982ae15f6", "container_name"=>"/telegraf", "source"=>"stderr", "log"=>"2023-03-26T17:16:51Z D! [outputs.influxdb] Buffer fullness: 0 / 10000 metrics"}]
[129] 75371422f9f9: [1679851058.000000000, {"container_id"=>"75371422f9f964ecc698d92d5b38a8f1338bb01c90b3aab55acf3e7982ae15f6", "container_name"=>"/telegraf", "source"=>"stderr", "log"=>"2023-03-26T17:17:01Z D! [outputs.influxdb] Wrote batch of 8 metrics in 106.666381ms"}]
[130] 75371422f9f9: [1679851058.000000000, {"log"=>"2023-03-26T17:17:01Z D! [outputs.influxdb] Buffer fullness: 0 / 10000 metrics", "container_id"=>"75371422f9f964ecc698d92d5b38a8f1338bb01c90b3aab55acf3e7982ae15f6", "container_name"=>"/telegraf", "source"=>"stderr"}]
Persisting Logging Information in InfluxDB
The final configuration extension is to store the log file information in InfluxDB. This is delightfully simple - you need to provide an InfluxDB running on the same computer, then add the following configuration stanza to the Fluent Bit configuration file:
pipeline:
  inputs:
    # ...

  outputs:
  - # ...
  - name: influxdb
    match: '*'
    host: influxdb
    port: 8086
    database: fluent
Once up and running, the logfile entries are stored in InfluxDB.
Entries from the system log are stored with three fields: time, _seq, and the log.
name: nexus
time                _seq log
----                ---- ---
1679189083162568096 7762 Mar 19 02:24:43 nexus docker-compose[7605]: #033[32mfluentd           |#033[0m [0] 3914a4322298: [1679189068.000000000, {\"container_name\"=>\"/pihole\", \"source\"=>\"stderr\", \"log\"=>\"s6-rc: info: service pihole-FTL successfully started\", \"container_id\"=>\"3914a432229883fca89d214f247a18dfa2776a4c624397a2ec8e13f9a61bbbf8\"}]
1679189083162576929 7763 Mar 19 02:24:43 nexus docker-compose[7605]: #033[32mfluentd           |#033[0m [1] 3914a4322298: [1679189068.000000000, {\"container_name\"=>\"/pihole\", \"source\"=>\"stderr\", \"log\"=>\"s6-rc: info: service lighttpd: starting\", \"container_id\"=>\"3914a432229883fca89d214f247a18dfa2776a4c624397a2ec8e13f9a61bbbf8\"}]
Entries from the Docker containers contains time, _seq, container_id, container_name, log and source.
time                _seq container_id                                                     container_name log                                                                                                                    source
----                ---- ------------                                                     -------------- ---                                                                                                                    ------
1679184308000000000 1    45be4380484492eacc66240dfdc1f2b29a601117a80dc0db6463d8760f753875 /grafana       logger=cleanup t=2023-03-19T00:05:08.906915647Z level=info msg=\"Completed cleanup jobs\" duration=113.996533ms        stdout
Conclusion
Fluent Bit makes logfile aggregation easy. Bundled as a single binary with low resource consumption and several plugins, it’s a very versatile tool to capture inputs, add metadata, and forward the logs to another system. In this article, you learned the differences between FluentD and Fluent Bit, saw how to install Fluent Bit, and understood the essential configuration via YAML files. With the code examples provided in this article, you are able to capture log files from the host in which Fluent Bit runs, and how to serve as the logging driver for Docker containers created with docker-compose. The next articles detail how to use fluentd to capture other logging sources and how to visualize logging information.