In a typical IOT network, several sensors with different hardware and software, and several computer and single board computers exist. Its challenging to get coherent metrics from all of them and storing them in a central database.
In my last article, I presented a guideline for defining the metrics collection goals and provided an overview about concrete agent, aggregators and stores. This article applies these guidelines and show the realization for my own IOT infrastructure: A Raspberry Pi that runs Docker containers, most important Home Assistant and ESP Home, and several esp8266/esp32 sensors.
The technical context of this article is Raspberry Pi OS 2024-11-19, Home Assistant v2024.10.4, InfluxDB v1.11.8 and Telegraf v1.30.3, but the instructions should work with newer releases as well.
Metrics Collection Concepts
The first step is to form a coherent metrics collection concept. When this is complete, we can evaluate and discus the concrete systems.
Following the questions outlined in my earlier article:
- Which computers do I have? => Raspberry Pi, Raspberry Zero
- Which sensors do I own? 3x ESP8266, 2x ESP32
- How does sensor information flow to applications? Sensor information is pulled by Home Assistant
- Do I want to measure the general liveliness of my devices? => Yes, each sensor and computer should send a liveness ping.
- For my computers, which hardware metrics are essential to monitor? CPU, disk, ram
- For my computers, which additional hardware metrics are helpful to monitor? Network statistics
- For my sensor, which software metrics in addition to the sensor data are helpful to monitor? Unknown - sensor code is provided by ESPHome
- For all computer metrics: How frequently should a metric being recorded? 5min
- For all sensor metrics: How frequently should a metric being recorded? For deep sleep sensors, once during wake time. For all others 5 minutes
- Which system collects these metrics? Sensor data is read by Home Assistant. For the computer metrics, no system exists.
- How does the metrics system collect data? Pull
- How long is the metrics data stored? 60 days
- If multiple systems collect data: Should the metrics data aggregated at a single machine? Yes, preferably I have one system
To these facts I will add the following picture about how sensors in my IOT network are connected:
- Sensors are configured with ESP Home and accessed by Home Assistant
- Sensors can be configured to send additional data via MQTT
- Home Assistant can read any sensors and any MQTT data
And for the computer:
- Computers do not expose hardware metrics yet
- NodeExporter and Telegraf can run as a Docker containers, collectd can be installed
- All aggregators could run as Docker containers, and Home Assistant is already used
- All storage applications could run as Docker containers, and Influx DB is already used
With this in mind, I will try to combine Telegraf, Home Assistant and InfluxDB.
Researching System Capabilities
For collecting computer hardware metrics, the Telegraf Agent can run as a Docker container on a host. By exposing the systems proc files, relevant hardware metrics can be extracted. Serving as an aggregator, it can store directly in a database, for example InfluxDB. And furthermore, it can also actively listen for data being published via MQTT and store them as well. I will use this mechanism to.
For sensor metrics the picture is a bit blank. I could find no projects to run Telegraf or a Node Exporter on ESP boards - they require a Linux based system with proc and device, things than an ESP does not have. And even if a project existed, I would need to integrate this with the code that ESPHome generated. However, I learned that recent versions of ESP Home enable expose information about the heap memory and loop counter of a sensor, and these can be feed into Home Assistant.
Continuing, I see that Home Assistant already performs the complete metric aggregation for all sensors. A normally configured Home Assistant installation uses and SQLite database to store sensor events and measurements. But with a simple tweak, Home Assistant will store all sensor state changes in an InfluxDB.
Since Telegraf also stores its data in InfluxDB, the final choice is easy. As an additional benefit, during early stages of my IOT network, sensor data was already stored in InfluxDB, and I explored its capabilities and how to query data in an earlier article too.
This finally boils down to this:
- Sensor publish metric if configured with ESPHome
- Home Assistant pulls sensor values
- Telegraf collects hardware metrics
- Sensors additionally publish an alive ping via MQTT
- Telegraf processes MQTT messages
- All metrics are stored in InfluxDB
All pieces are together! Now let’s install and configure all of this. In the next section, I detail the configuration for all systems. During my research, I learned that Home Assistant can take a much broader role than anticipated here - these sections are titled with try to represent that they were only investigated, but not used.
Metrics Agent
ESPHome: Generate Sensor Metrics
For any sensor, debug text information, such as the device info, and the statistics about its heap memory can be exposed via a debug platform configuration:
debug:
  update_interval: 5s

text_sensor:
  - platform: debug
    device:
      name: "esp8266-01.metrics.device-info"

sensor:
  - platform: debug
    free:
      name: "esp8266-01.metrics.heap-free"
    fragmentation:
      name: esp8266-01.metrics.heap-fragmentation"
    block:
      name: "esp8266-01.metrics.loop-time"
    loop_time:
      name: "Loop Time"

logger:
  level: debug
Once configured, data is automatically pulled from Home Assistant. For testing, you can add a dashboard card:

Try: Home Assistant Computer Metrics
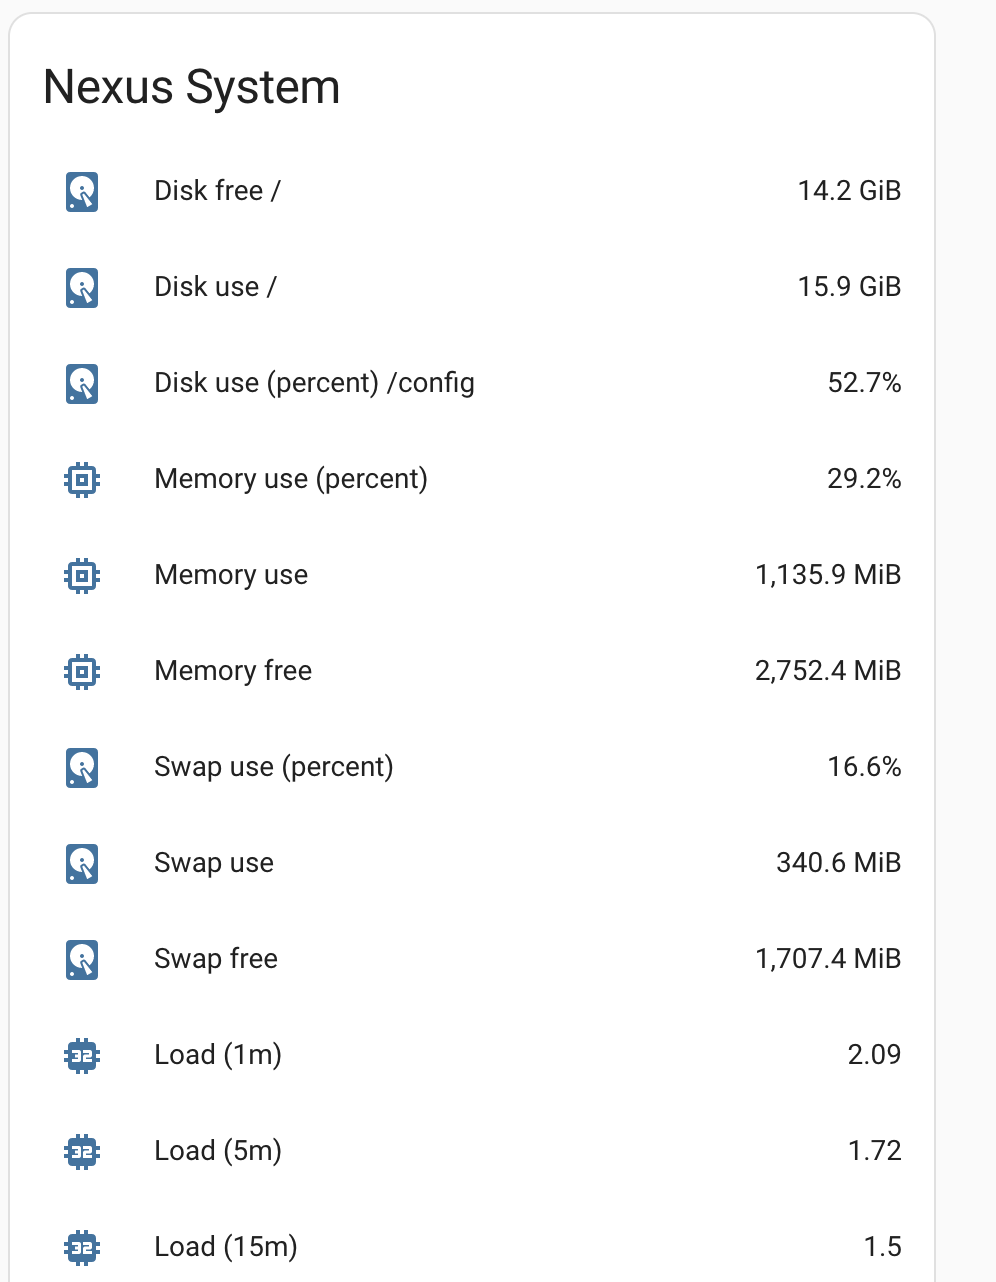
Out of curiosity, I used this handy plugin for collecting data from the host system. To active it, add a new sensor systemmonitor to your configuration.yaml file:
sensor:
- platform: systemmonitor
  resources:
    - type: disk_use_percent
      arg: /config
    - type: disk_use
    - type: disk_free
    - type: memory_use_percent
    - type: memory_use
    - type: memory_free
    - type: swap_use_percent
    - type: swap_use
    - type: swap_free
    - type: load_1m
    - type: load_5m
    - type: load_15m
    - type: network_in
      arg: eth0
    - type: network_out
      arg: eth0
    - type: throughput_network_in
      arg: eth0
    - type: throughput_network_out
      arg: eth0
    - type: packets_in
      arg: eth0
    - type: packets_out
      arg: eth0
    - type: ipv4_address
      arg: eth0
    - type: ipv6_address
      arg: eth0
    - type: processor_use
    - type: processor_temperature
    - type: last_boot
Upon a restart, several entities called sensor_ will be defined. Add a summary card to your dashboard to see them:

Telegraf Computer Metrics
Telegraf runs as a Docker container that is defined inside a docker-compose.yml file, and this in turn maps a configuration file from the host to the container.
First we define an agent definition that defines the collection frequency and additionally fine-grained tunings about the upload size of metrics and more.
[agent]
  interval = "5min"
  round_interval = true
Second, we define the metrics that should be collected. The following configuration collects cpu, disks and memory stats.
[[inputs.cpu]]
  percpu = false
  totalcpu = true
  collect_cpu_time = false
  report_active = false

[[inputs.disk]]
  mount_points = ["/", "/mnt/share"]

[[inputs.mem]]
After a restart, metrics are gathered faithfully.
Metrics Aggregation
Home Assistant Sensor Metrics Aggregation
As illustrated above, Home Assistant does not need any additional configuration to store sensor metrics - once you have defined them in ESPHome, the will be stored automatically.
Try: Home Assistant MQTT Listener
During investigating the options, I found out that Home Assistant can be configured to listen to any MQTT topic. For example, to listen to the /alive topic of a specific node, add the following configuration:
- platform: mqtt
  state_topic: '/nodes/esp8266-01/alive'
  name: 'esp8266-01.metrics.alive'
As before, Home Assistant listens to this topic and updates its internal state accordingly. However, Telegraf has a simpler and less verbose option for this processing step.
Telegraf MQTT Listener
Telegraf aggregates the configured hardware metrics autonomously - no additional configuration is required. To listen to any MQTT topics, you need to define the target server, a list of topics, and the data format.
[[inputs.mqtt_consumer]]
  servers = ["tcp://mosquitto:1883"]
  data_format = "value"
  data_type = "float"
  max_undelivered_messages = 1000
  topics = ["nodes/#"]
Parsing MqTT messages turned out to be tricky. In essence, you configure a transformation from the original MQTT message to the InfluxDB line protocol. The line protocols has this syntax: measurement,[tag=value]* [field=value] timestamp.
Lets make this practical. Assume that the MQTT message is /nodes/raspberry-zero/cpu_temperature 54,5. From this topic string, cpu_temperature needs to be the measurement, and we need to define the tag entity=raspberry_zero, and the field temperature=54.5. This transformation is achieved with topic parsing. With a special syntax, you map MQTT topic parts to the InfluxDB line protocol. The above mentions transformation is achieved as follows:
[[inputs.mqtt_consumer]]
  # ....
  topics = ["nodes/#"]
  [[inputs.mqtt_consumer.topic_parsing]]
    topic = "nodes/+/+/"
    measurement = "_/measurement/"
    tags = "sensor_id/_"
    fields = "_/temperature"
Here, we see the following declaration:
- Line 3: Telegraf listens to all topics that start with
nodes - Line 5: This specific topic parser listens to the topic
nodeswith two segments, and these segments are used to index the message content. - Line 6: The measurement name is the 2nd part of the segment
- Line 7: The tag
entityis the first part of the segment - Line 8: The field name is
temperatureand its value is the payload
Metric Store
Home Assistant: Configure InfluxDB Storage
Home Assistant uses an internal SQL Lite database. In additional, all sensor stat changes can be stored in InfluxDB as well. For this feature, the HA configuration.yaml needs to extended as follows:
influxdb:
  host: influxdb
  port: 1886
  database: home_assistant
  username: REDACTED
  password: REDACTED
After a restart of the Docker container, both sensor metrics and the sensor values are stored in InfluxDB.
Telegraf: Configure InfluxDB Storage
Telegraf can output any internally or by an input plugin provided data to InfluxDB as well. Use this configuration:
[[outputs.influxdb]]
   urls = ["http://influxdb:8086"]
   database = "telegraf"
   database_tag = ""
   exclude_database_tag = false
   skip_database_creation = false
   retention_policy = ""
   write_consistency = "any"
   timeout = "5s"
   username = REDACTED
   password = REDACTED
As before, you need to restart the Docker container for this change to be applied.
Conclusion
In this article, you learned how to combine InfluxDB, MQTT, Home Assistant and Telegraf to create, aggregated and store computer and sensor metrics. In essence, all data is stored in InfluxDB, Home Assistant gets and stores sensor metrics, and Telegraf get and stores computer metrics. Additional metrics exposed via MQTT are also processed and stored with Telegraf. Wit this approach, you only need to configure three applications for a precise metrics data flow and long term storage.
Now it’s only up to you to provide meaningful dashboards - here is a preview from my sensor metrics visualization.
