In this article, I show how to write a simple heartbeat script that runs regularly on your laptop, desktop computer or IOT device to signal that it is still operational. To store and process the data, we need an IOTstack consisting of MQTT, NodeRed and InfluxDB - see my earlier articles in the series. The device from which we measure the heartbeat needs to be able to run a Python script.
The technical context of this article is Raspberry Pi OS 2021-05-07 and Telegraf 1.18.3. All instructions should work with newer versions as well.
Installation
Install the paho-mqtt library.
python3 -m pip install paho-mqtt
Following the paho-documention, we need to create a client, connect it to the broker, and then send a message. The basic code is this:
#!/usr/bin/python3

import paho.mqtt.client as mqtt

MQTT_SERVER = "192.168.178.40"
MQTT_TOPIC = "/nodes/macbook/alive"

client = mqtt.Client()
client.connect(MQTT_SERVER)
client.publish(MQTT_TOPIC, 1)
To test, lets connect to the docker container running mosquitto and use the mosquito_sub cli tool.
docker exec -it mosquitto sh
mosquitto_sub -t /nodes/macbook/alive
1
1
1
Values are received. Now we will execute this script every minute via a cronjob.
On OsX, run crontab -e in your terminal and enter this line (with the appropriate file path).
* * * * * /usr/local/bin/python3 /Users/work/development/iot/scripts/heartbeat.py
Our computer now continuously publishes data. Let’s see how this message can be transformed and stored inside InfluxDB.
Data Transformation: Simple Workflow
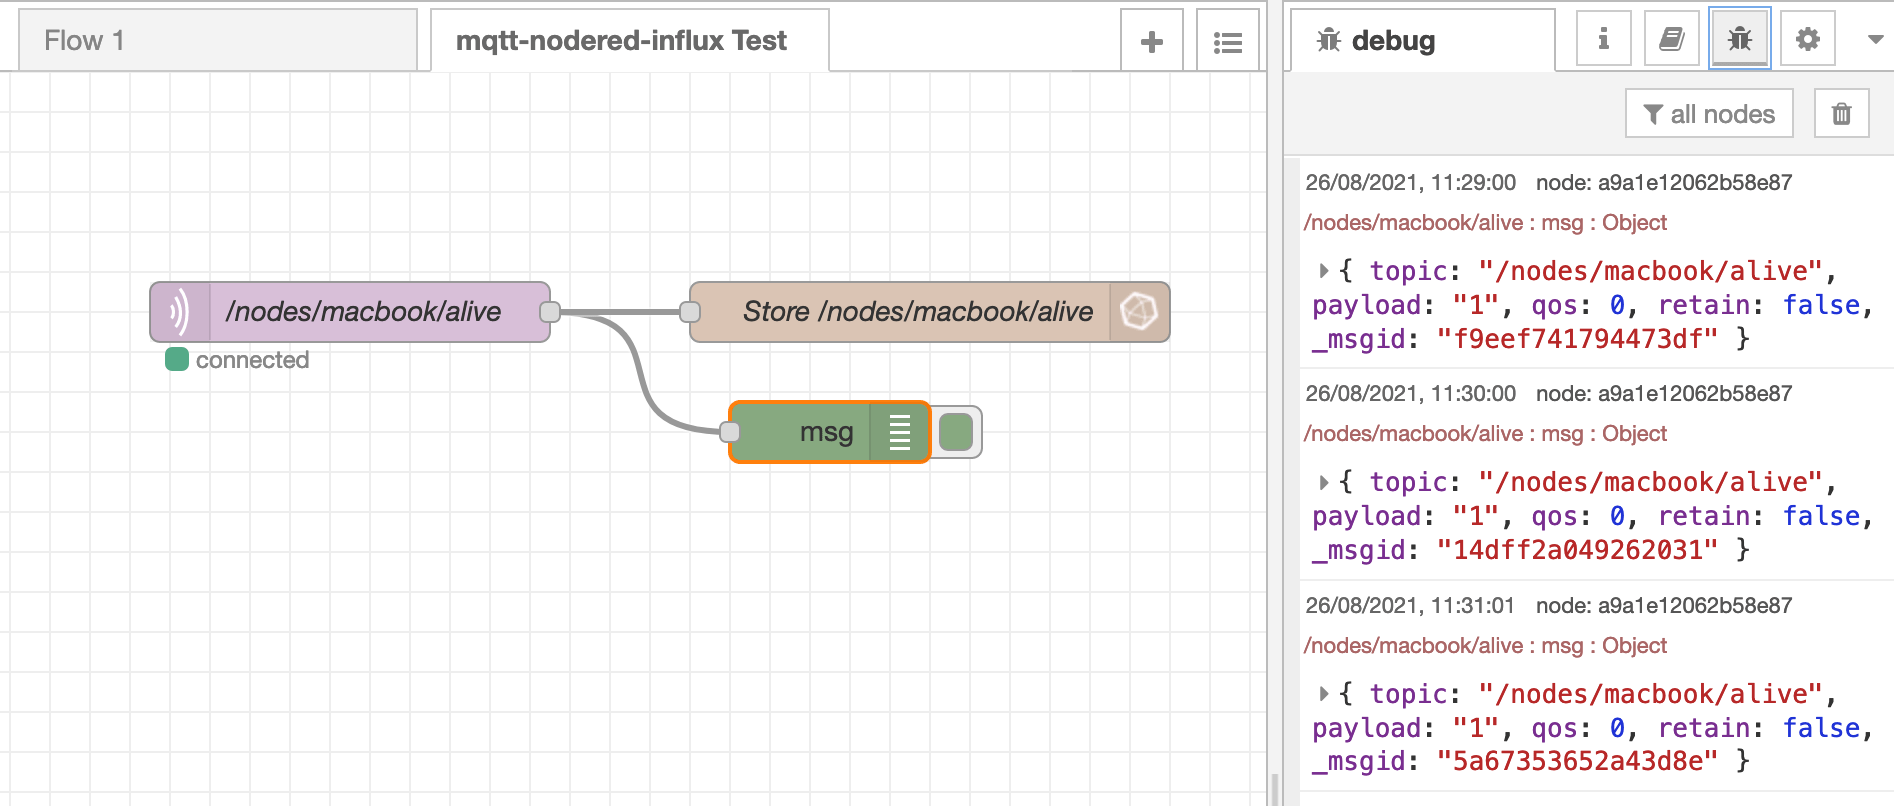
NodeRed is the application of choice to handle message listening and transformation. In this first iteration we will create a very simple workflow that just stores the received value in InfluxDB. The flow looks as follows:

It consists of the two nodes mqtt-in and influxdb-out, plus an additional debug node to see how the input data is structured. When this workflow is deployed, the debug messages arrive.

However, the data looks rather simple in InfluxDB:
show field keys
name: alive
fieldKey fieldType
-------- ---------
value    string
This data is too specific. It should at least distinguish for which node we receive the keep alive ping.
Data Transformation: Advanced Workflow
For the advanced workflow, we change things from the bottom up. The topic will be /nodes, and the message is not a single value, but structured JSON. We want to send this data:
{
  "node":"macbook",
  "alive":1
}
Therfore, the Python script is changed accordingly:
import paho.mqtt.client as mqtt

MQTT_SERVER = "192.168.178.40"
MQTT_TOPIC = "/nodes"

client = mqtt.Client()
client.connect(MQTT_SERVER)
client.publish(MQTT_TOPIC, '{"node":"macbook", "alive":1}')
The updated NodeRed workflow looks as follows:

It consists of these nodes:
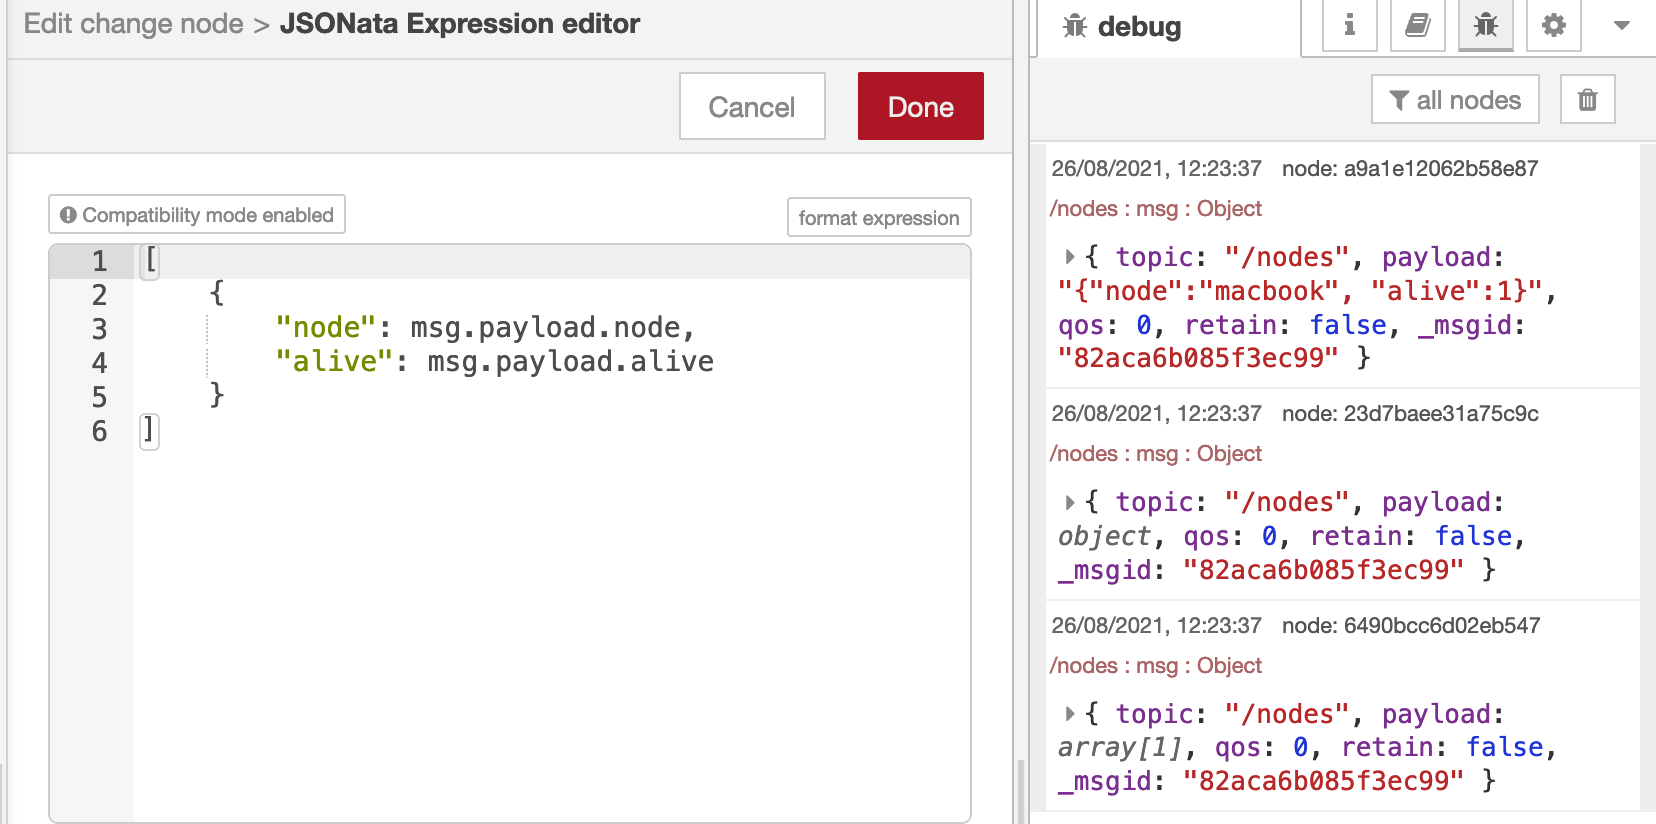
mqtt-in: Listens to the topic/nodes, outputs a stringjson: Converts the inputsmsg.payloadfrom sting to JSONchange: Following a best practice advice, this node transforms the input data to the desired InfluxDB output data. When new fields are added or you change filed names, you just need to modify one wokflow node. It sets themsg.payloadJSON to this form:
[
  {
      "node": msg.payload.node,
      "alive": msg.payload.alive
  }
]
influxdb-out: Store themsg.payloadas tags in the InfluxDB measurementsnode
Using debug messages, we can see the transformation steps:

And in the InfluxDB, values look much better structured:
select * from alive
name: alive
time                alive node
----                ----- ----
1629973500497658493 1     macbook
Visualization with Grafana
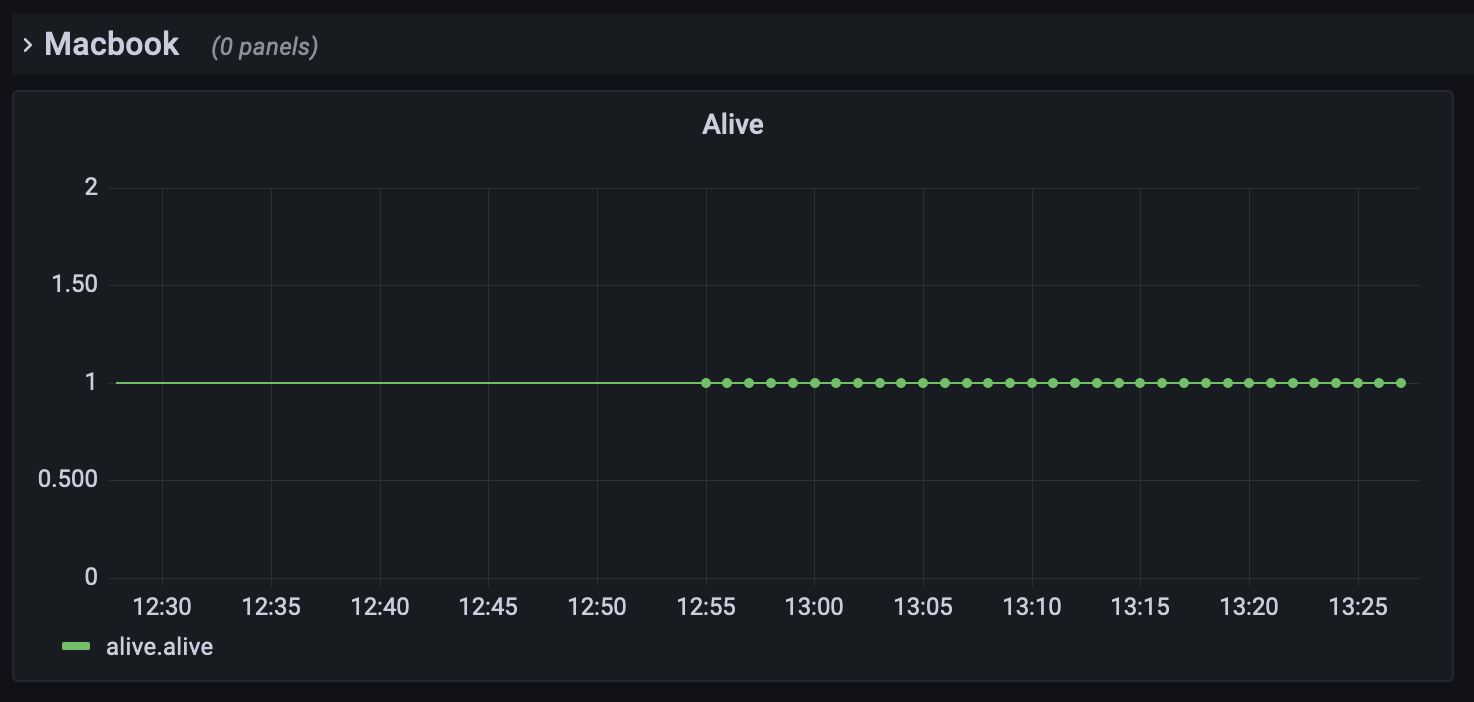
The final step is to add a simple Grafana panel.

Now start to gather data from additional nodes, add additional metrics, and you will have your own personal dashboard of all IOT devices.
Conclusion
An IOT Stack consisting of MQTT, NodeRed and InfluxDB is a powerful combination for start sending, transforming, storing and visualizing metrics. This article showed the essential steps to record a heartbeat message for your nodes. With a Python script, structured data containing the node and its uptime status is send to an MQTT broker within a well-defined topic. A NodeRed workflow listens to this topic, converts the message to JSON and creates an output JSON that is send to InfluxDB. And finally, a Grafana dashboard visualizes the data.
